【R】kdtools
2021年8月28日
1. はじめに
kdtoolsは、配列やデータフレームを処理する様々なツールをまとめたパッケージです。
2. インストール
CRANからインストールできます。
install.packages("kdtools")3. つかってみる
ソートしてみます。
library(kdtools)
library(tidyverse)
data(diamonds)
diamonds_sorted <- kd_sort(diamonds, cols = c(3, 4, 2))
head(diamonds_sorted)
> head(diamonds_sorted)
# A tibble: 6 x 10
  carat cut   color clarity depth table price     x     y     z
  <dbl> <ord> <ord> <ord>   <dbl> <dbl> <int> <dbl> <dbl> <dbl>
1  1.7  Fair  D     I1       64.7    56  5617  7.46  7.37  4.8
2  1.51 Good  D     I1       57      64  5979  7.48  7.53  4.28
3  1.02 Good  D     SI2      63.4    59  4633  6.37  6.41  4.05
4  0.9  Fair  D     SI2      66      58  3205  6     5.97  3.95
5  0.32 Good  D     SI2      63.4    56   477  4.36  4.38  2.77
6  1    Good  D     SI2      64      59  3569  6.24  6.29  4.01
ソートした結果から、ある範囲のデータを取り出します。
lower <- c(1, 55)
upper <- c(1.2, 62)
kd_range_query(diamonds_sorted, lower, upper, cols = c(1, 5))
# A tibble: 1 x 10
carat cut color clarity depth table price x y z
<dbl> <ord> <ord> <ord> <dbl> <dbl> <int> <dbl> <dbl> <dbl>
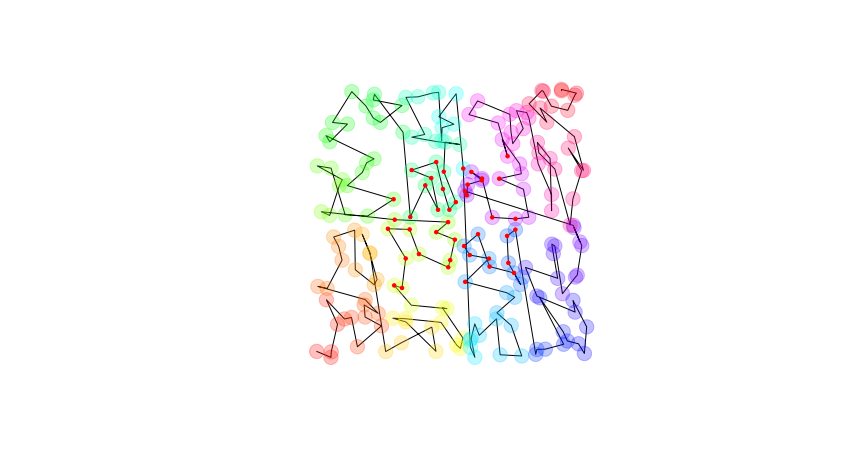
1 1.01 Premium F VS1 61.7 58 7507 6.43 6.4 3.96x = kd_sort(matrix(runif(400), 200)) plot(x, type = 'l', asp = 1, axes = FALSE, xlab = NA, ylab = NA) points(x, pch = 19, col = rainbow(200, alpha = 0.25), cex = 2) y = kd_range_query(x, c(1/4, 1/4), c(3/4, 3/4)) points(y, pch = 19, cex = 0.5, col = "red")
4. さいごに
なんか、いろいろできそうですね。
