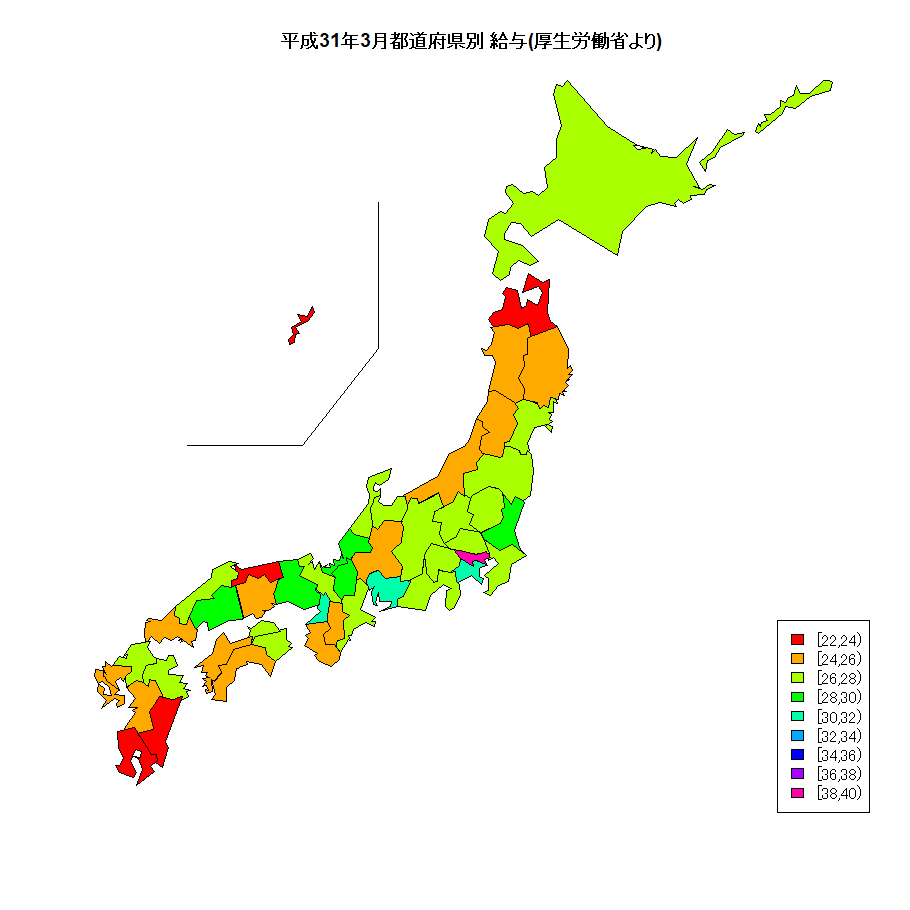
【R】都道府県別 平均給与をプロットしてみる
2019年12月25日
厚生労働省が公表している『毎月勤労統計調査地方調査 平成31年3月分結果概要』から、全事業所の現金給与総額を計算して平均給与として地図上にプロットしてみた。
library(leaflet)

dat <- read.csv("http://www.dinov.tokyo/Data/JP_Pref/JapanData.csv", header = TRUE,
                 fileEncoding="CP932")

datc_m <- cut(dat$平均給与, hist(dat$平均給与, plot=FALSE)$breaks, right=FALSE)
datc_mcol <- rainbow(length(levels(datc_m)))[as.integer(datc_m)]
windowsFonts(JP1=windowsFont("MS Gothic"),
             JP2=windowsFont("MS Mincho"),
             JP3=windowsFont("Meiryo"),
             JP4=windowsFont("Biz Gothic"))
windows(width=800, height=800)
par(family="JP4")

library(NipponMap)
JapanPrefMap(datc_mcol, main="平成31年3月都道府県別 給与(厚生労働省より) ")
legend("bottomright", fill=rainbow(length(levels(datc_m))), legend=names(table(datc_m)))

予想していましたが、東京の一人勝ちですね。。。。その他、主要都市は高めですが、地方が厳しいです。。。
