【R】Text rendering
2020年6月5日
1.はじめに
ggtextというパッケージでは、ggplotでHTMLやMarkdown記述でテキストをレンダリングできます。すべてのMarkdown/HTML要素をサポートしているわけではないようですが、theme要素やgeomに装飾できるようです。
ggtext: Improved text rendering support for ggplot2を試してみました。
2.インストール
最新版は、gitから
remotes::install_github("wilkelab/ggtext")CRANからは通常通り
install.packages("ggtext")3.使ってみる
3.1 MarkdownでのTheme
library(tidyverse)
library(ggtext)
library(glue)

data <- tibble(
  bactname = c("Staphylococcaceae", "Moraxella", "Streptococcus", "Acinetobacter"),
  OTUname = c("OTU 1", "OTU 2", "OTU 3", "OTU 4"),
  value = c(-0.5, 0.5, 2, 3)
)

data %>% mutate(
  color = c("#009E73", "#D55E00", "#0072B2", "#000000"),
  name = glue("<i style='color:{color}'>{bactname}</i> ({OTUname})"),
  name = fct_reorder(name, value)
)  %>%
  ggplot(aes(value, name, fill = color)) +
  geom_col(alpha = 0.5) +
  scale_fill_identity() +
  labs(caption = "Example posted on **stackoverflow.com**<br>(using made-up data)") +
  theme(
    axis.text.y = element_markdown(),
    plot.caption = element_markdown(lineheight = 1.2)
  )
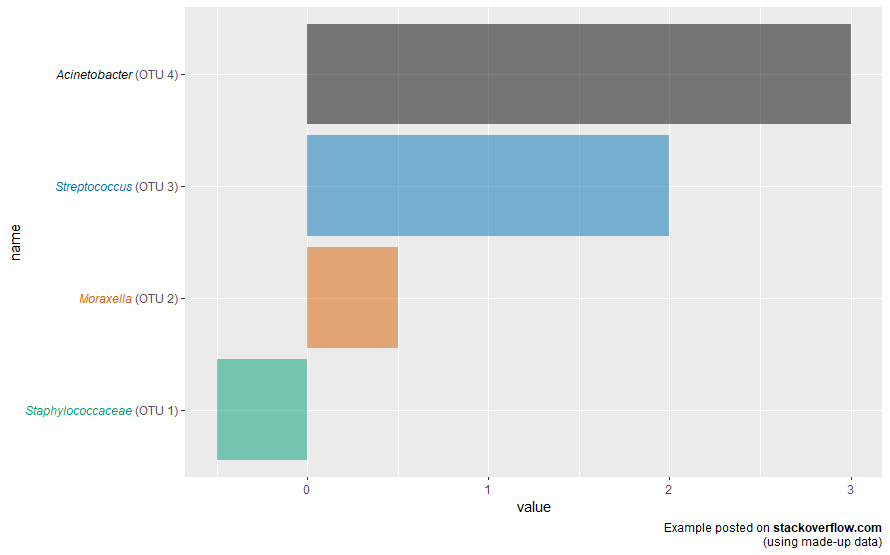
ちゃんとy軸がMarkdownで装飾されています。
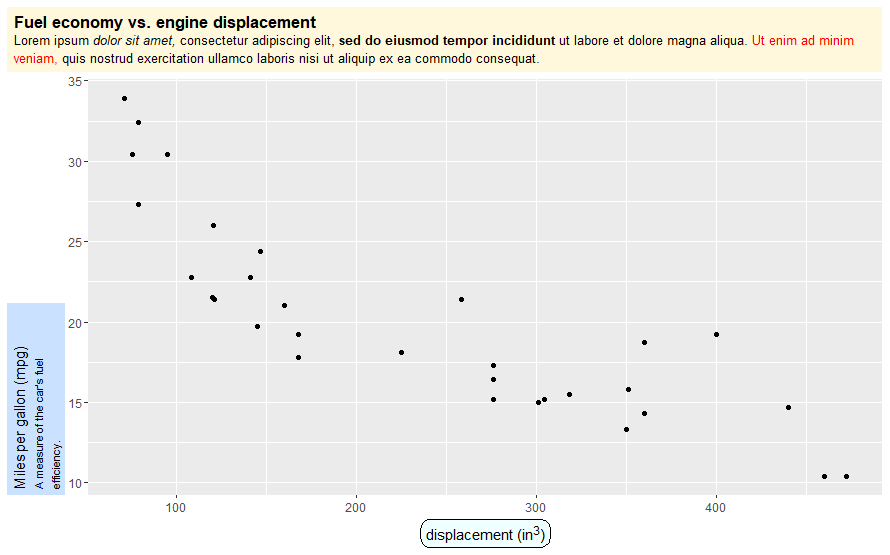
続いて、mtcarのデータを表示。titleを装飾しています。element_textbox_simpleで細かく設定。
ggplot(mtcars, aes(disp, mpg)) +
  geom_point() +
  labs(
    title = "<b>Fuel economy vs. engine displacement</b><br>
    <span style = 'font-size:10pt'>Lorem ipsum *dolor sit amet,*
    consectetur adipiscing elit, **sed do eiusmod tempor incididunt** ut
    labore et dolore magna aliqua. <span style = 'color:red;'>Ut enim
    ad minim veniam,</span> quis nostrud exercitation ullamco laboris nisi
    ut aliquip ex ea commodo consequat.</span>",
    x = "displacement (in<sup>3</sup>)",
    y = "Miles per gallon (mpg)<br><span style = 'font-size:8pt'>A measure of
    the car's fuel efficiency.</span>"
  ) +
  theme(
    plot.title.position = "plot",
    plot.title = element_textbox_simple(
      size = 13,
      lineheight = 1,
      padding = margin(5.5, 5.5, 5.5, 5.5),
      margin = margin(0, 0, 5.5, 0),
      fill = "cornsilk"
    ),
    axis.title.x = element_textbox_simple(
      width = NULL,
      padding = margin(4, 4, 4, 4),
      margin = margin(4, 0, 0, 0),
      linetype = 1,
      r = grid::unit(8, "pt"),
      fill = "azure1"
    ),
    axis.title.y = element_textbox_simple(
      hjust = 0,
      orientation = "left-rotated",
      minwidth = unit(1, "in"),
      maxwidth = unit(2, "in"),
      padding = margin(4, 4, 2, 4),
      margin = margin(0, 0, 2, 0),
      fill = "lightsteelblue1"
    )
  )
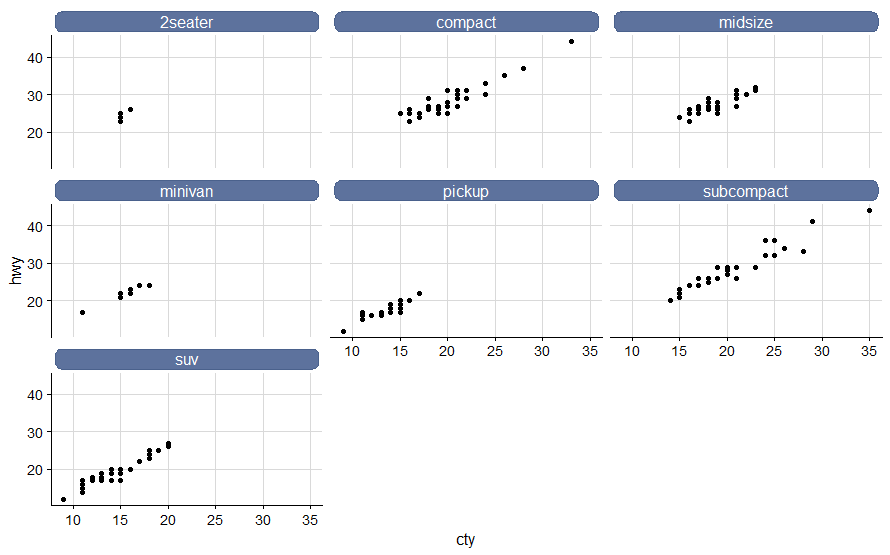
library(cowplot)

ggplot(mpg, aes(cty, hwy)) +
  geom_point() +
  facet_wrap(~class) +
  theme_half_open(12) +
  background_grid() +
  theme(
    strip.background = element_blank(),
    strip.text = element_textbox(
      size = 12,
      color = "white", fill = "#5D729D", box.color = "#4A618C",
      halign = 0.5, linetype = 1, r = unit(5, "pt"), width = unit(1, "npc"),
      padding = margin(2, 0, 1, 0), margin = margin(3, 3, 3, 3)
    )
  )
3.2 Geom
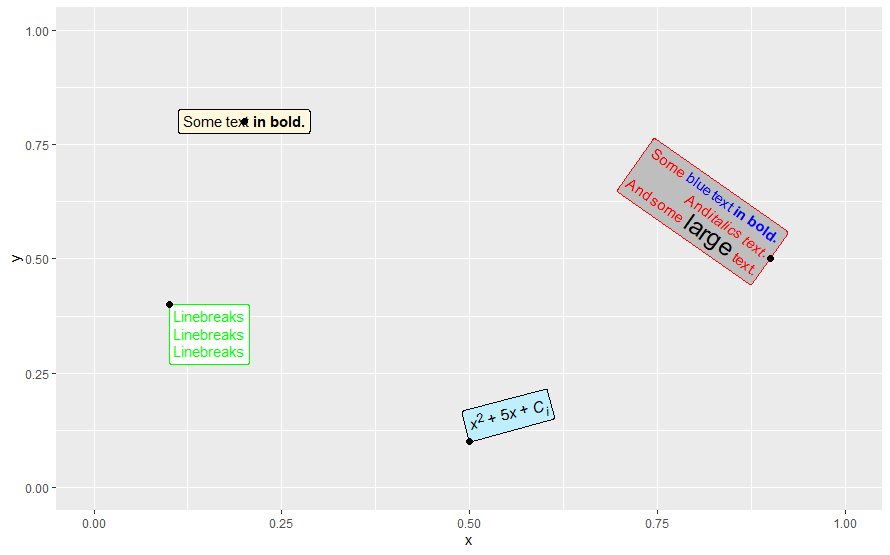
geom_richtext()でさらに柔軟なMarkdown表現ができ、回転もできます。
df <- tibble(
  label = c(
    "Some text **in bold.**",
    "Linebreaks<br>Linebreaks<br>Linebreaks",
    "*x*<sup>2</sup> + 5*x* + *C*<sub>*i*</sub>",
    "Some <span style='color:blue'>blue text **in bold.**</span><br>And *italics text.*<br>
    And some <span style='font-size:18pt; color:black'>large</span> text."
  ),
  x = c(.2, .1, .5, .9),
  y = c(.8, .4, .1, .5),
  hjust = c(0.5, 0, 0, 1),
  vjust = c(0.5, 1, 0, 0.5),
  angle = c(0, 0, 15, -35),
  color = c("black", "green", "black", "red"),
  fill = c("cornsilk", "white", "lightblue1", "grey")
)

ggplot(df) +
  aes(
    x, y, label = label, angle = angle, color = color, fill = fill,
    hjust = hjust, vjust = vjust
  ) +
  geom_richtext() +
  geom_point(color = "black", size = 2) +
  scale_color_identity() +
  scale_fill_identity() +
  xlim(0, 1) + ylim(0, 1)
4.おわりに
強力なグラフ機能をもつggplotですが、ggtextを使うことで文字を制御できて、さらにグラフの表現力が増しますね。