【R】複数の変数の散布図
2020年3月1日
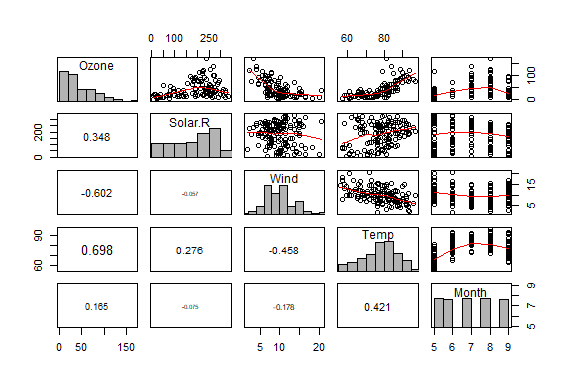
panel.hist <- function(x, ...){
  usr <- par("usr"); on.exit(par(usr))
  par(usr=c(usr[1:2], 0, 1.5))
  h<-hist(x, plot=FALSE)
  breaks <- h$breaks
  nB <- length(breaks)
  y <- h$counts; y<-y/max(y)
  rect(breaks[-nB], 0, breaks[-1], y, col="gray70", ...)
}

panel.cor<-function(x, y, digits=3){
  usr<-par("usr"); on.exit(par(usr))
  par(usr=c(0, 1, 0, 1))
  r<-cor(x, y, use="complete")
  txt<-round(r, digits)
  text(0.5, 0.5, txt, cex=0.8/strwidth(txt)*abs(r)^0.25)
}

plot(airquality[,1:5], lower.panel=panel.cor, upper.panel=panel.smooth, diag.panel=panel.hist)
【参考】Rによる統計解析、青木繁伸著、オーム社
