【julia】統計解析(t検定)
2020年4月8日
RDatasetsからデータを引っ張り出して、juliaにて統計解析(t検定)をしてみました。
using RDatasets, Gadfly, DataFrames, DataFramesMeta, Statistics, HypothesisTests,
Fontconfig, Cairo
# データ読込、要約統計量の表示、箱ヒゲ図のプロット
RDatasets.datasets("datasets")
dat = RDatasets.dataset("datasets","PlantGrowth")
Gadfly.plot(dat, x = :Group, y = :Weight, Geom.boxplot)
# t検定用にデータ処理(Groupの値ごとに)
dat_ctrl = @linq dat |> where(:Group .== "ctrl") |> select(:Weight, :Group)
dat_trt1 = @linq dat |> where(:Group .== "trt1") |> select(:Weight, :Group)
dat_trt2 = @linq dat |> where(:Group .== "trt2") |> select(:Weight, :Group)
describe(dat_ctrl)
describe(dat_trt1)
describe(dat_trt2)
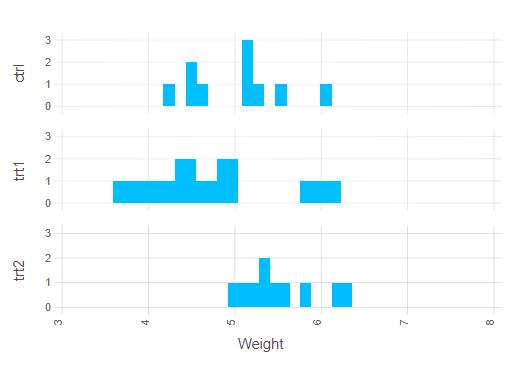
# パラメトリック検定できるか、ヒストグラムを確認
Gadfly.plot(dat, ygroup = :Group, x = :Weight, Geom.subplot_grid(Geom.histogram(bincount = 15)))
# 平均値の差を検定、等分散と非等分散
EqualVarianceTTest(dat_ctrl[:, :Weight], dat_trt1[:, :Weight])
EqualVarianceTTest(dat_ctrl[:, :Weight], dat_trt2[:, :Weight])
UnequalVarianceTTest(dat_ctrl[:, :Weight], dat_trt1[:, :Weight])
UnequalVarianceTTest(dat_ctrl[:, :Weight], dat_trt2[:, :Weight])

こちらのサイト「Julia でふつうの統計解析」を参考にさせていただきました。
