【R】地図を描いてみる(tmap編 その3)
2020年5月1日
tmapでもう少しいろいろ地図を描いてみます。
「Basic Mapping」を参考にさせていただきました。データは、GeoDa Data and Lab が提供するRental Housing and Demographics in NYC (2000s)を使います。Downloadしてunzipしておきます。
library(sf)
library(tmap)
nyc.bound <-st_read("nyc/nyc.shp")
st_crs(nyc.bound)
plot(nyc.bound)
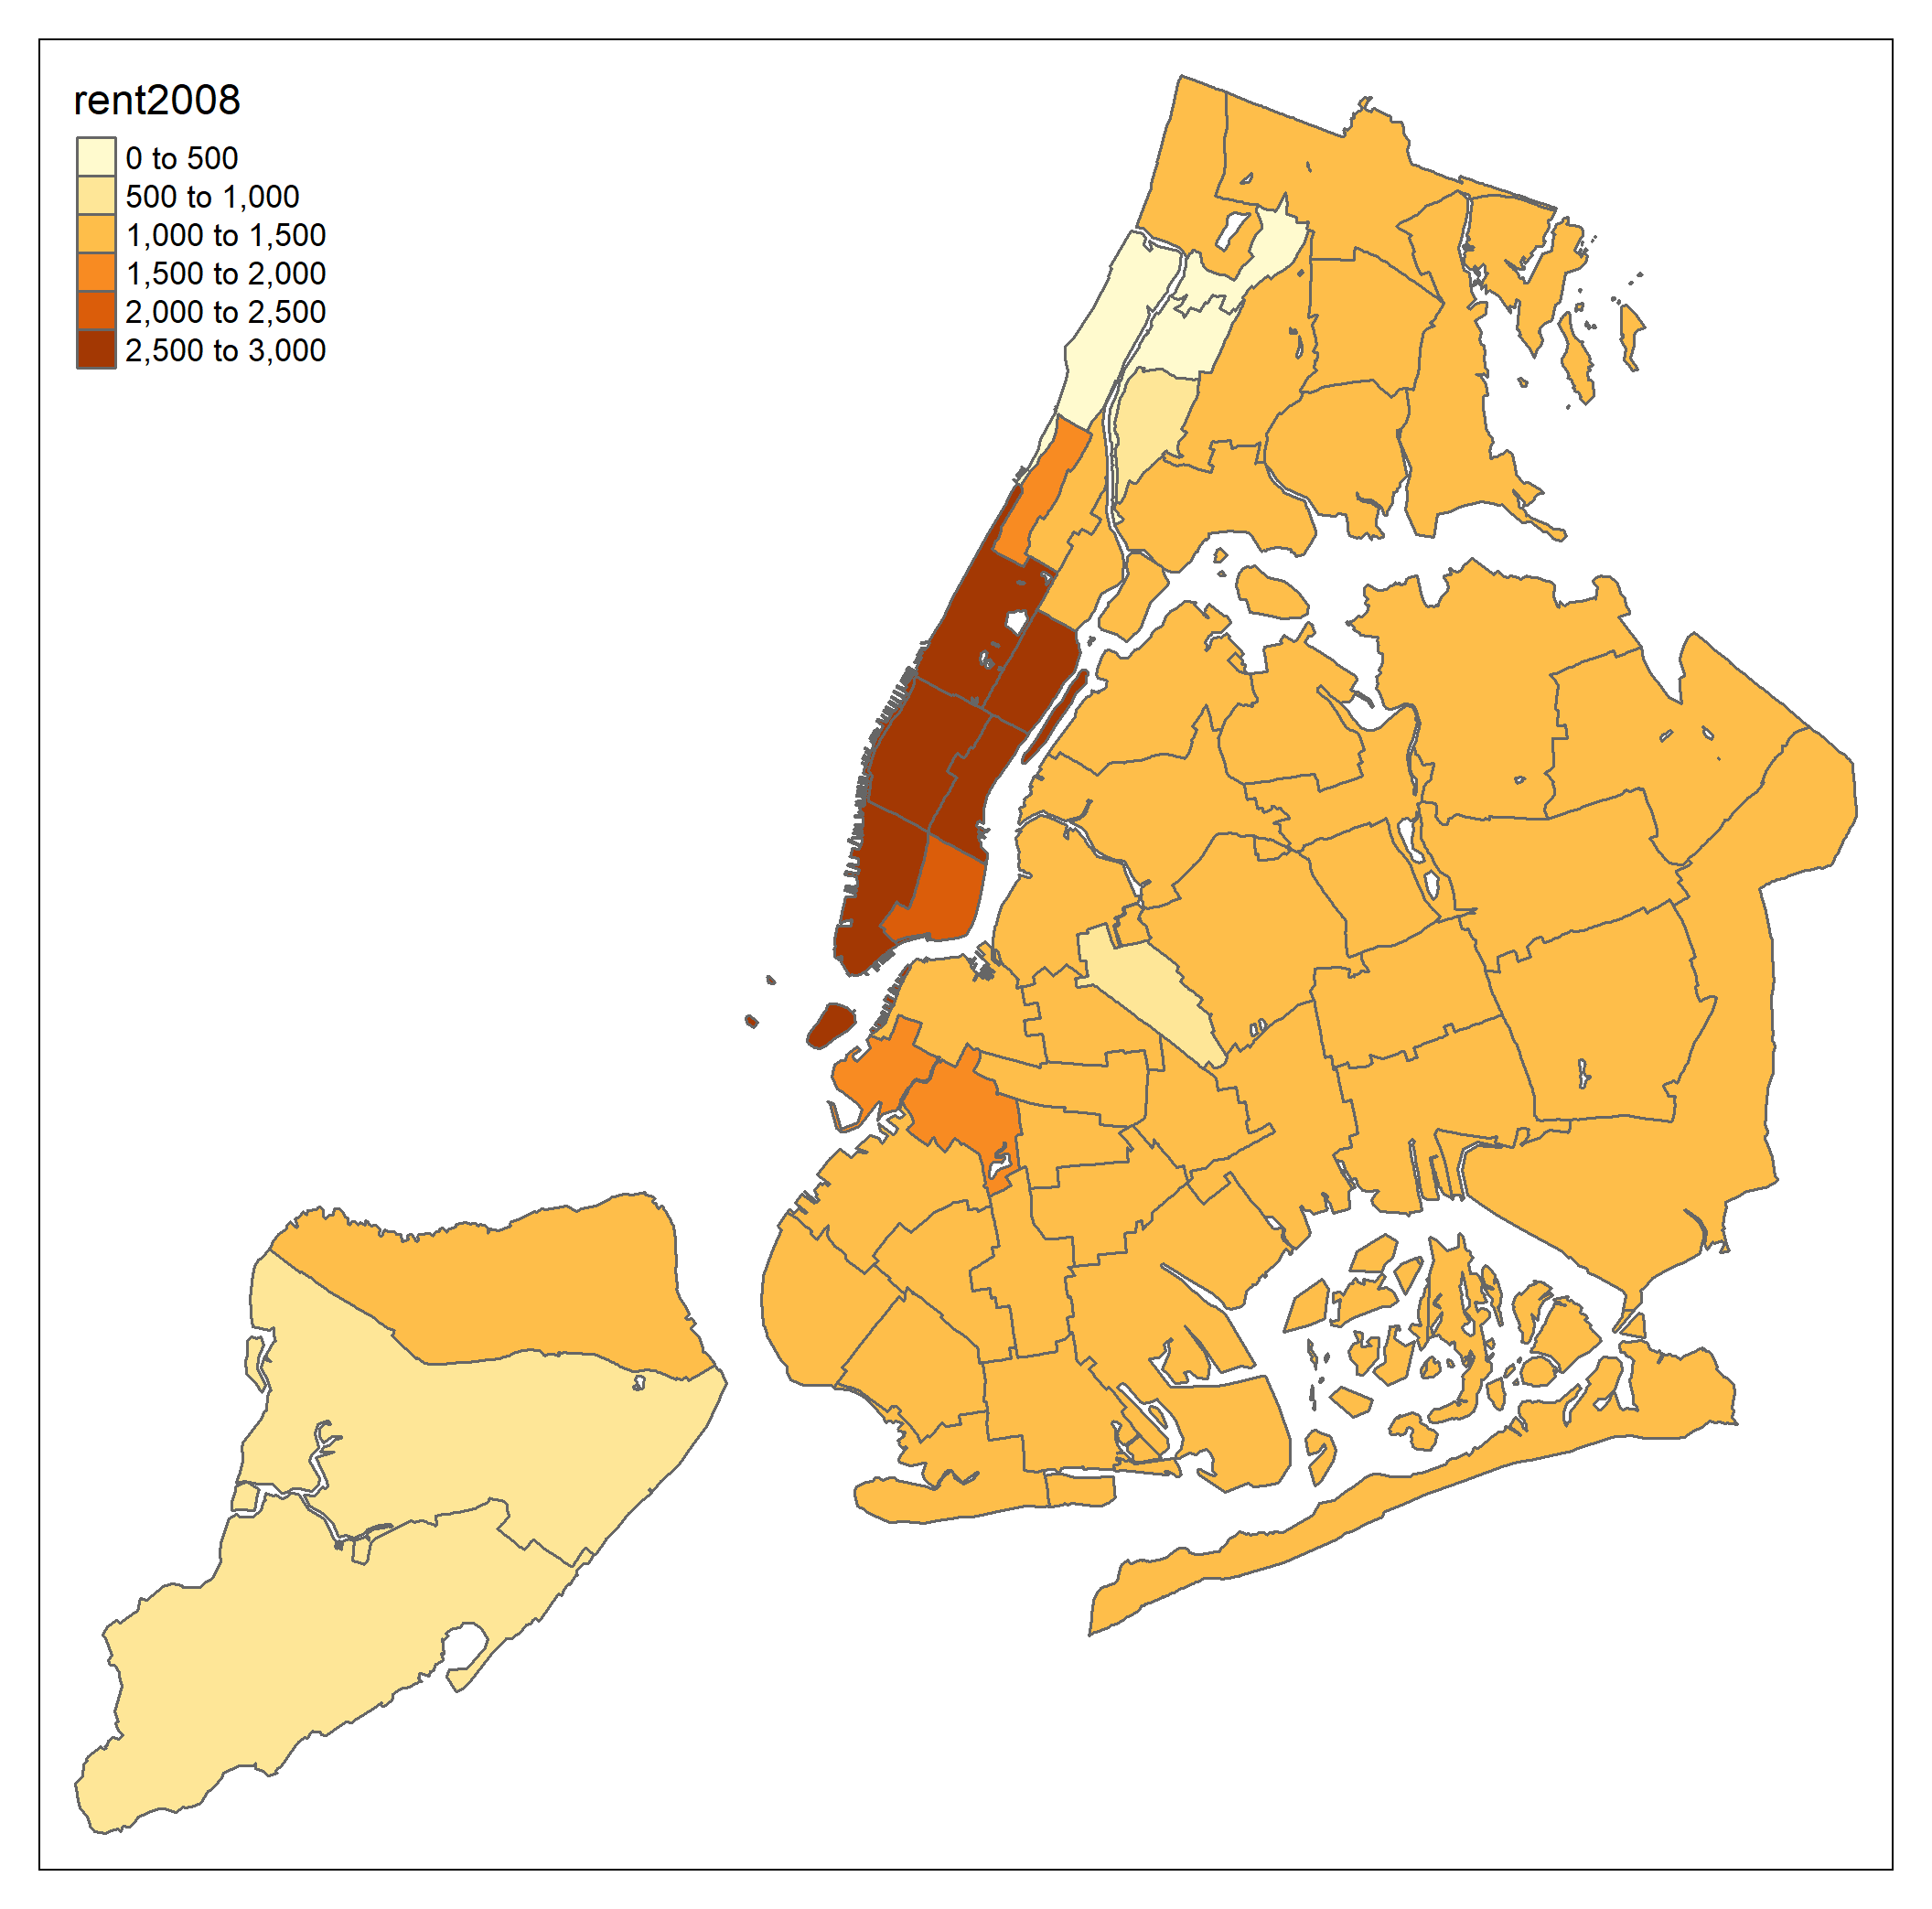
tmap_mode("plot")
nymap<-tm_shape(nyc.bound) +
tm_polygons("rent2008")
tmap_save(tm = nymap, filename = "nyc_rent_map.png")
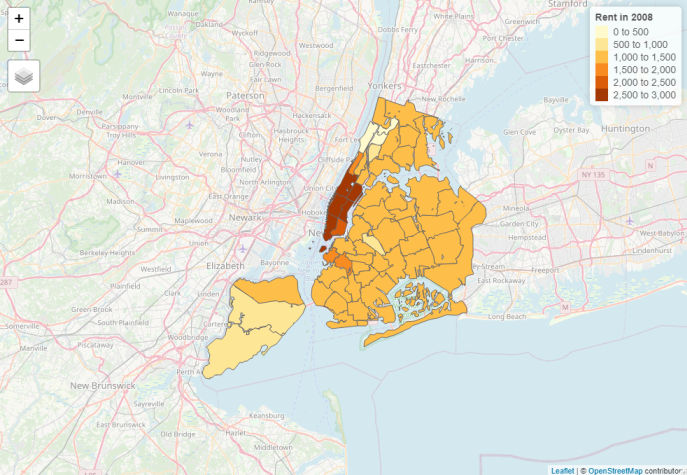
tmap_mode("view")
tm_shape(nyc.bound) +
tm_fill("rent2008",title="Rent in 2008",legend.hist=TRUE) +
tm_borders() +
tm_layout(main.title = "Rent 2008 NYC Sub-Boroughs", main.title.position="center", legend.outside = TRUE, legend.outside.position = "right") +
tm_basemap(server="OpenStreetMap",alpha=0.5)
このように、leafletでインタラクティブな地図も表示されます。