【R】Wes Anderson Palletes
2020年6月18日
1. はじめに
色は、見る人に印象付ける意味で重要ですよね。図表やグラフなども色によって印象が変わってきます。面白い色パレットとしてのパッケージwesandersonがあります。
2. インストール
CRANからインストールできます。
install.packages("wesanderson")3. 使ってみる
どんなパレットがあるか、名前を見てみます。
library("wesanderson")
names(wes_palettes)
 [1] "BottleRocket1"  "BottleRocket2"  "Rushmore1"      "Rushmore"       "Royal1"         "Royal2"
 [7] "Zissou1"        "Darjeeling1"    "Darjeeling2"    "Chevalier1"     "FantasticFox1"  "Moonrise1"
[13] "Moonrise2"      "Moonrise3"      "Cavalcanti1"    "GrandBudapest1" "GrandBudapest2" "IsleofDogs1"
[19] "IsleofDogs2"
グラフにパレットを使ってみます。
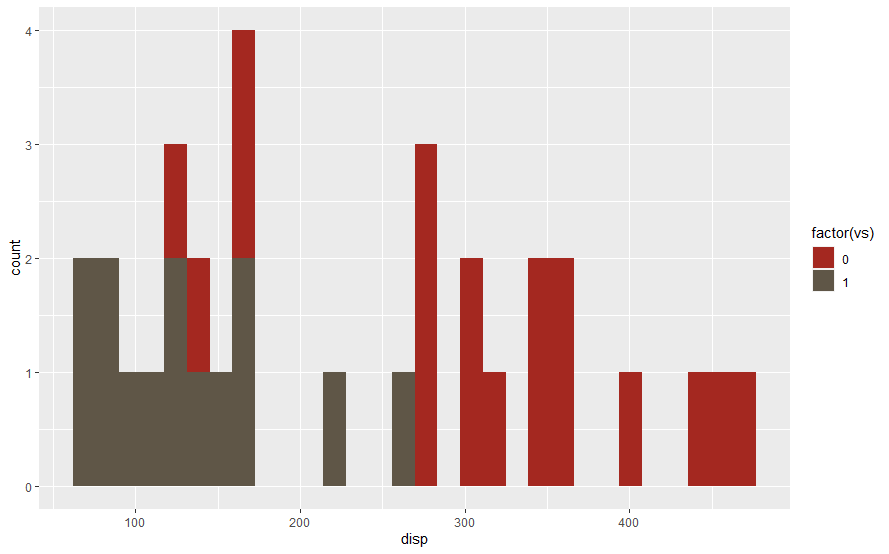
library("ggplot2")
ggplot(mtcars, aes(disp, fill=factor(vs))) +
  geom_histogram() +
  scale_fill_manual(values = wes_palette("BottleRocket1"))
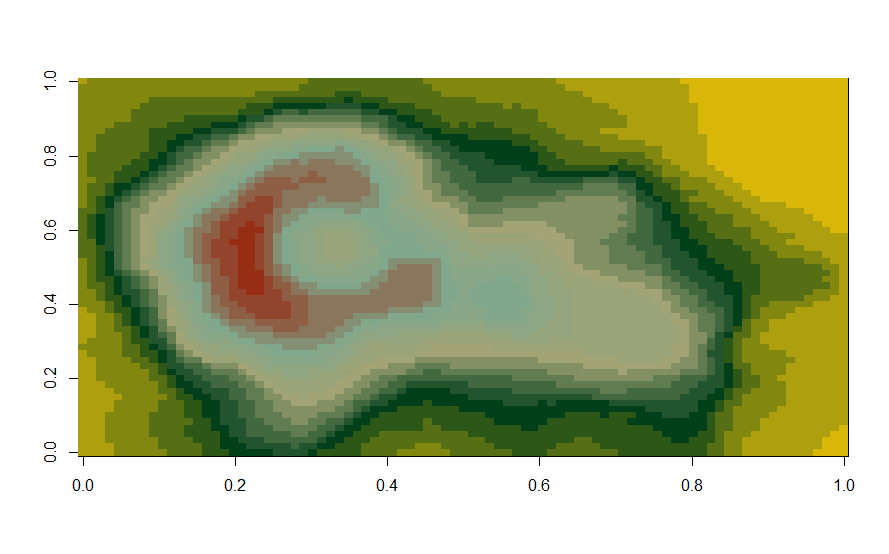
イメージの色付けにも
pal <- wes_palette("Cavalcanti1", 21, type = "continuous")
image(volcano, col = pal)
4. おわりに
簡単にいろんなパレットを使えて便利です。
