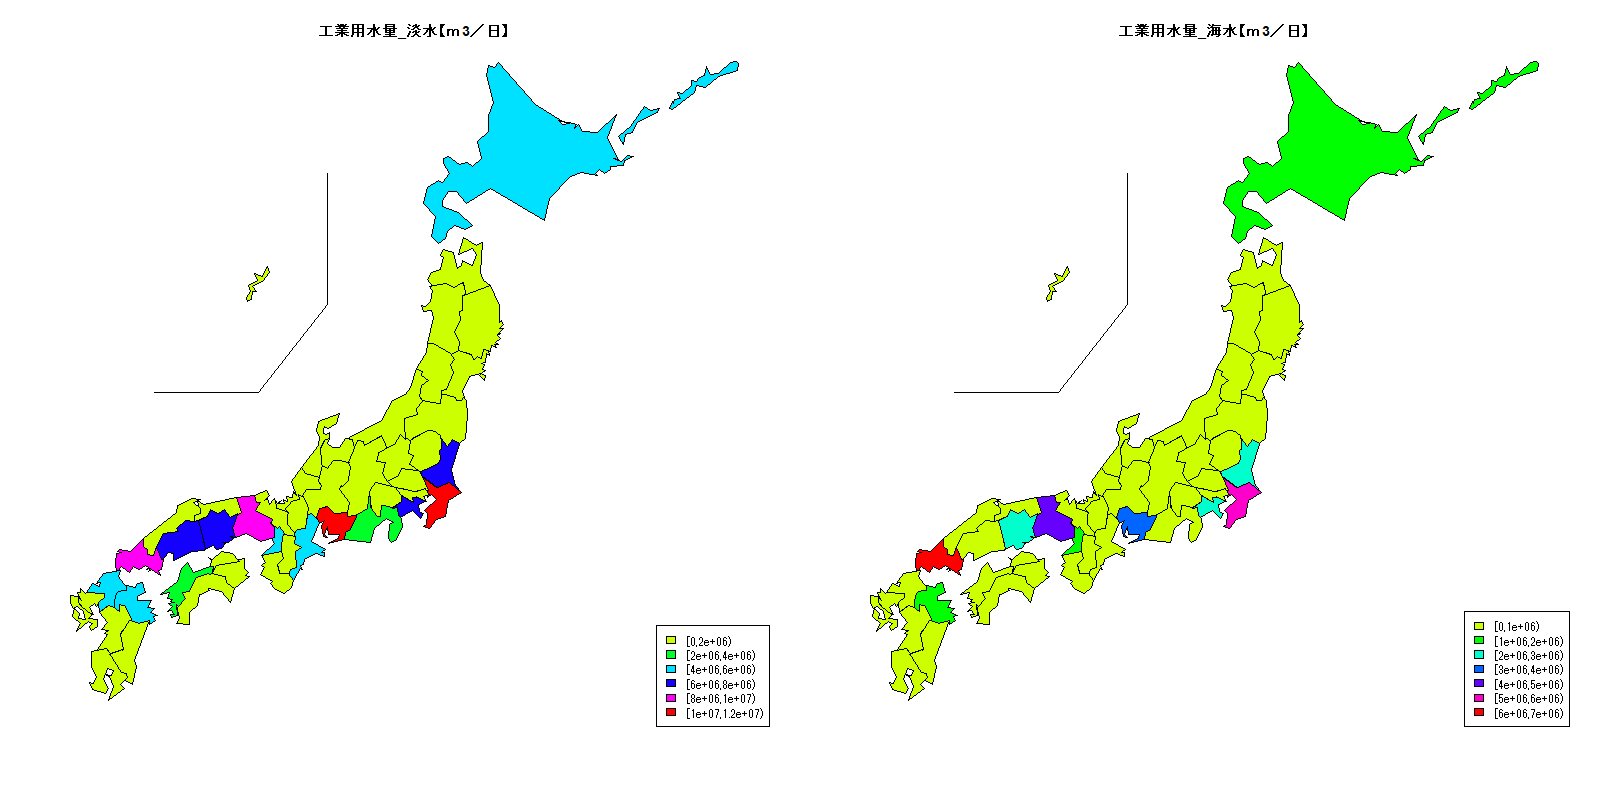
総務省統計局が発表している「都道府県・市区町村のすがた(社会・人口統計体系)」から、都道府県別の2015年の工業用水量(淡水、海水)【m3/日】を表示してみます。

| 都道府県 |
工業用水量_淡水 |
工業用水量_海水 |
| 北海道 |
5144476 |
1696035 |
| 青森 |
842263 |
24337 |
| 岩手 |
347534 |
115949 |
| 宮城 |
879492 |
679 |
| 秋田 |
285407 |
216000 |
| 山形 |
252960 |
0 |
| 福島 |
1025527 |
370148 |
| 茨城 |
6124252 |
2069210 |
| 栃木 |
1133520 |
0 |
| 群馬 |
853328 |
0 |
| 埼玉 |
1290689 |
0 |
| 千葉 |
10627474 |
5495020 |
| 東京 |
472324 |
0 |
| 神奈川 |
6608077 |
2700831 |
| 新潟 |
1827276 |
0 |
| 富山 |
1471456 |
963 |
| 石川 |
564014 |
0 |
| 福井 |
687635 |
0 |
| 山梨 |
110522 |
0 |
| 長野 |
641286 |
0 |
| 岐阜 |
840303 |
0 |
| 静岡 |
3719686 |
46722 |
| 愛知 |
11465131 |
3072317 |
| 三重 |
4873888 |
928985 |
|
| 都道府県 |
工業用水量_淡水 |
工業用水量_海水 |
| 滋賀 |
1026908 |
0 |
| 京都 |
387755 |
0 |
| 大阪 |
4221719 |
1031703 |
| 兵庫 |
9098238 |
4634404 |
| 奈良 |
48921 |
0 |
| 和歌山 |
1624029 |
942330 |
| 鳥取 |
159986 |
0 |
| 島根 |
409904 |
2160 |
| 岡山 |
7337205 |
2031561 |
| 広島 |
6762948 |
944480 |
| 山口 |
9293898 |
6402288 |
| 徳島 |
1215178 |
100074 |
| 香川 |
247325 |
545028 |
| 愛媛 |
3062438 |
809083 |
| 高知 |
174100 |
16767 |
| 福岡 |
4568950 |
969154 |
| 佐賀 |
253840 |
0 |
| 長崎 |
79868 |
89595 |
| 熊本 |
752392 |
689 |
| 大分 |
4357525 |
1474756 |
| 宮崎 |
1016822 |
21000 |
| 鹿児島 |
207989 |
32230 |
| 沖縄 |
277162 |
99282 |
|
|
library(leaflet)
library(knitr)
library(kableExtra)
library(dplyr)
library(tidyr)
library(stringr)

dat <- read.csv("http://www.dinov.tokyo/Data/JP_Pref/Pref_data.csv", header = TRUE, fileEncoding="UTF-8")
col_start <- 0.2
col_end <- 0.0


table_df<-data.frame(都道府県=dat$都道府県, 工業用水量_淡水=dat$工業用水量_淡水, 工業用水量_海水=dat$工業用水量_海水)

datc_k <- cut(dat$工業用水量_淡水, hist(dat$工業用水量_淡水, plot=FALSE)$breaks, right=FALSE)
datc_kcol <- rainbow(length(levels(datc_k)), start = col_start, end=col_end)[as.integer(datc_k)]
datc_m <- cut(dat$工業用水量_海水, hist(dat$工業用水量_海水, plot=FALSE)$breaks, right=FALSE)
datc_mcol <- rainbow(length(levels(datc_m)), start = col_start, end=col_end)[as.integer(datc_m)]

library(NipponMap)
windowsFonts(JP4=windowsFont("Biz Gothic"))
windows(width=1600, height=800)

png("0plot1.png", width = 1600, height = 800)
par(family="JP4")
layout(matrix(1:2, 1, 2))
JapanPrefMap(datc_kcol, main="工業用水量_淡水【m3/日】")
legend("bottomright", fill=rainbow(length(levels(datc_k)), start = col_start, end=col_end), legend=names(table(datc_k)))
JapanPrefMap(datc_mcol, main="工業用水量_海水【m3/日】")
legend("bottomright", fill=rainbow(length(levels(datc_m)), start = col_start, end=col_end), legend=names(table(datc_m)))
dev.off()

library(clipr)
t1=kable(table_df[c(1:24),], align = "c", row.names=FALSE) %>%
  kable_styling(full_width = F) %>%
  column_spec(1, bold = T) %>%
  collapse_rows(columns = 1, valign = "middle")
t2=kable(table_df[c(25:47),], align = "c", row.names=FALSE) %>%
  kable_styling(full_width = F) %>%
  column_spec(1, bold = T) %>%
  collapse_rows(columns = 1, valign = "middle")
paste(c('<table><tr valign="top"><td>', t1, '</td><td>', t2, '</td><tr></table>'), sep = '') %>% write_clip