【R】福井県の人口別コロプレス図
2020年8月17日
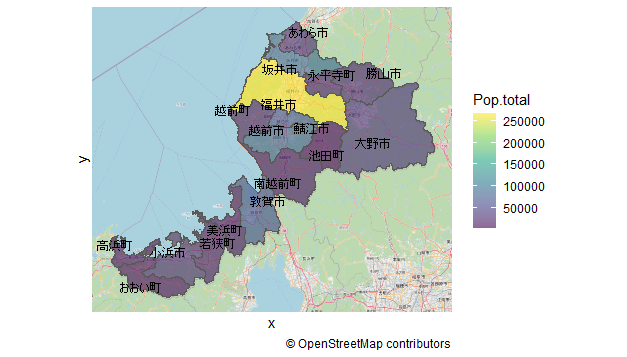
福井県の市区町村を人口別に塗りつぶしてみます。境界の描画は「地図で見る統計(統計GIS)」の「18000 福井県全域 世界測地系緯度経度・Shapefile」から取得します。
library(ggplot2)
library(ggrepel)
library(sf)
library(tidyverse)
library(kableExtra)
library(ggspatial)

map <- read_sf("shp/h27ka18.shp") # 福井県のシェープファイル


dat <- map %>%
  group_by(CITY_NAME) %>% # 市名でグルーピング
  summarize('Pop.total' = sum(JINKO))  %>% # グループ単位で領域結合, 人口計算
  mutate( # 重心計算と座標値の抽出
    centroid = st_centroid(geometry),
    x = st_coordinates(centroid)[, 1],
    y = st_coordinates(centroid)[, 2]
  ) %>%
  arrange(desc(Pop.total))

dat %>%
  ggplot() +
  annotation_map_tile(zoomin = 0) +
  geom_sf(aes(fill = Pop.total)) +  # 人口毎に色分け
  coord_sf(datum = NA) +
  scale_fill_viridis_c(alpha = 0.6) +
  theme_void()+
  geom_text_repel(aes(x = x, y = y, label = CITY_NAME), col="black",
                  family = "JP4", size = 3) +
  labs(caption = "\U00a9 OpenStreetMap contributors") +
  theme_minimal()


table_df<-data.frame(市区町村=dat$CITY_NAME, 人口=dat$Pop.total)

library(clipr)
table_df %>%
  kable(align = "c", row.names=FALSE) %>%
  kable_styling(full_width = F) %>%
  column_spec(1, bold = T) %>%
  collapse_rows(columns = 1, valign = "middle") %>%
  write_clip
| 市区町村 | 人口 |
|---|---|
| 福井市 | 265904 |
| 坂井市 | 90280 |
| 越前市 | 81524 |
| 鯖江市 | 68284 |
| 敦賀市 | 66165 |
| 大野市 | 33109 |
| 小浜市 | 29670 |
| あわら市 | 28729 |
| 勝山市 | 24125 |
| 越前町 | 21538 |
| 永平寺町 | 19883 |
| 若狭町 | 15257 |
| 南越前町 | 10799 |
| 高浜町 | 10596 |
| 美浜町 | 9914 |
| おおい町 | 8325 |
| 池田町 | 2638 |
