【R】simplevis
2021年6月13日
1. はじめに
simplevisは、少ない脳力とタイピングでggplotの美しいグラフ描画をアシストしてくれるパッケージです。
2. インストール
CRANからインストールできます。
install.packages("simplevis")3. 使ってみる
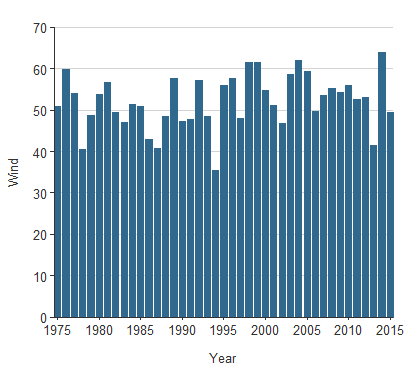
まずは、棒グラフ。
library(simplevis)
library(tidyverse)

plot_data <- storms %>%
  group_by(year) %>%
  summarise(wind = mean(wind))

gg_bar(plot_data, year, wind)
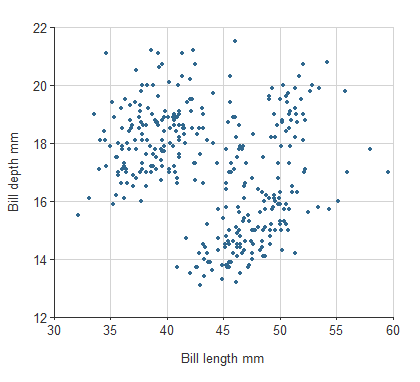
次に、散布図。
library(palmerpenguins)
data(penguins)

dat <- penguins %>% drop_na(bill_length_mm)
gg_point(dat, bill_length_mm, bill_depth_mm)
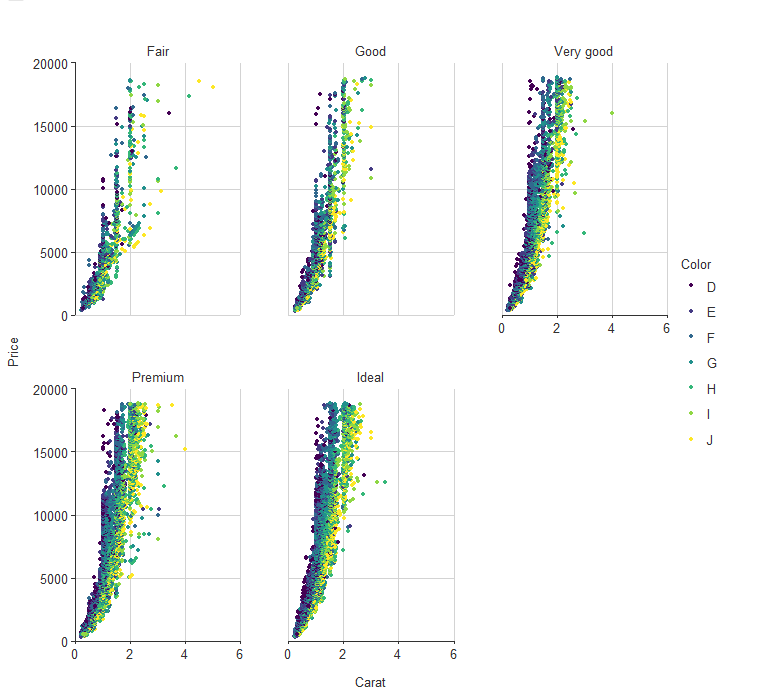
color やfacetもできます。
gg_point_col_facet(penguins, bill_length_mm, body_mass_g, sex, species)
4. さいごに
細かい設定は難しいかもしれませんが、手軽に確認するのには、簡単に使えるのでいいですね!
