【R】easyclimate
2021年7月14日
1. はじめに
easyclimateは、欧州の気象情報(降水量、最高・最低気温)をEuropean climatic databaseから取得できるパッケージです。1950年から2017年までのデータを取得できます。
2. インストール
Githubからインストールできます。
remotes::install_github("VeruGHub/easyclimate")3. つかってみる
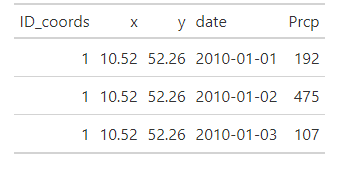
Braunschweigの2010年のデータを取得してみます。
library(easyclimate)

coords <- matrix(c(10.52, 52.26), ncol = 2)
prec <- get_daily_climate(coords,
                          period = "2010-01-01:2010-01-03",
                          climatic_var = "Prcp")

gt::gt(prec)
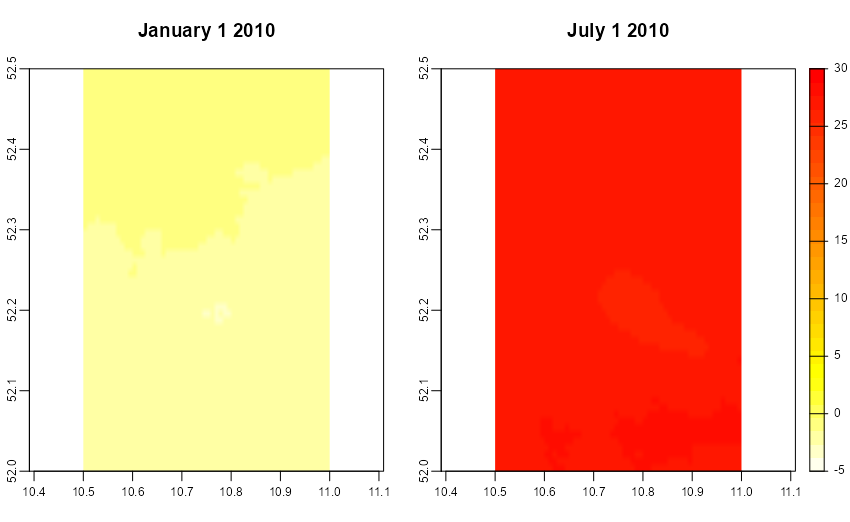
raster形式で取得してプロットもできます。
coords_poly <- vect("POLYGON ((10.5 52, 10.5 52.5, 11 52, 11 52.5))")

ras_tmax <- get_daily_climate(
  coords_poly,
  period = c("2010-01-01", "2010-07-01"),
  climatic_var = "Tmax",
  output = "raster" # return raster
)

ras_tmax <- ras_tmax/100

par(mfrow = c(1, 2))
terra::plot(ras_tmax, 1, col = rev(heat.colors(30)), type = "continuous", smooth = TRUE, range = c(-5, 30), legend = FALSE, mar=c(4, 2, 4, 2), main = "January 1 2010")
terra::plot(ras_tmax, 2, col = rev(heat.colors(30)), type = "continuous", smooth = TRUE, range = c(-5, 30), mar = c(4, 1, 4, 3), main = "July 1 2010")
4. さいごに
データのダウンロードに結構な時間がかかりました・・・(サーバーのせい?)。でも、非常に簡単にデータを取得できるのでありがたいパッケージです。
