【R】ggfittext
2021年4月13日
1. はじめに
ggfittextは、gplot2でtextをfitさせるgeomを提供してくれるパッケージです。
2. インストール
CRANからインストールできます。
install.packages("ggfittext")3. つかってみる
まずは、例にあるものを試してみます。
library(ggplot2)
library(ggfittext)

ggplot(animals, aes(x = type, y = flies, label = animal)) +
  geom_tile(fill = "white", colour = "black") +
  geom_fit_text()
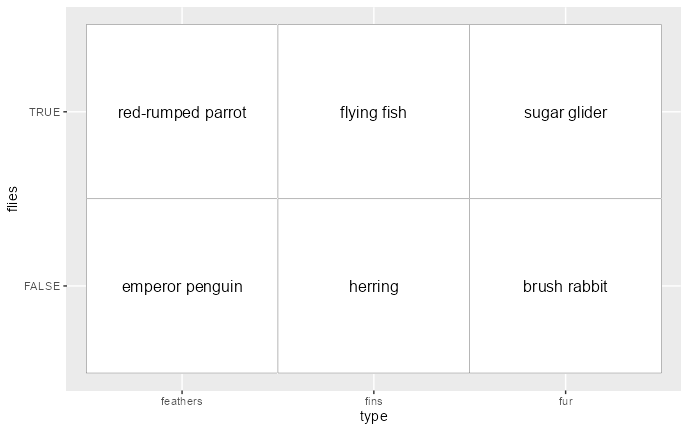
枠の中にanimalのラベルを付けることができます。
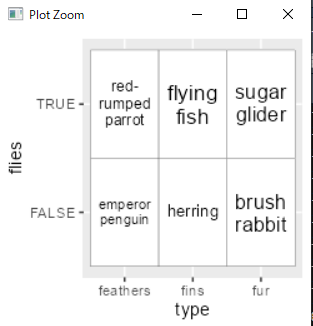
折込やサイズ自動最大化もできます。
ggplot(animals, aes(x = type, y = flies, label = animal)) +
  geom_tile(fill = "white", colour = "black") +
  geom_fit_text(reflow = TRUE, grow = TRUE)
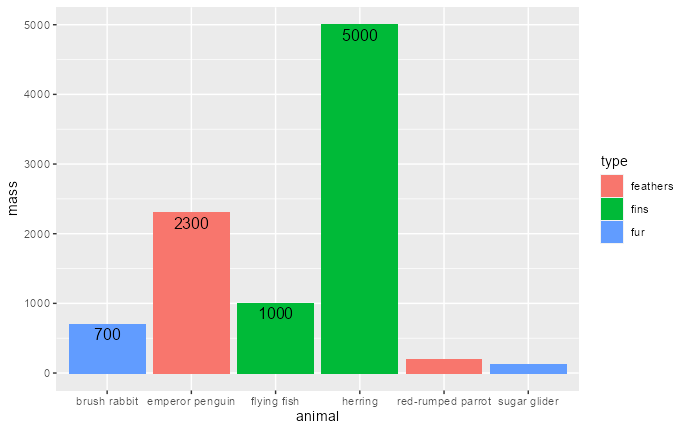
棒グラフ等の中にも文字を入れられます。
ggplot(animals, aes(x = animal, y = mass, label = mass,
                      fill = type)) +
  geom_col(position = "stack") +
  geom_bar_text(position = "stack", reflow = TRUE)
4. さいごに
グラフ内に文字を入れられるのはいいですね。分かりやすさが違います。
