【R】滋賀県の人口別コロプレス図
2020年8月21日
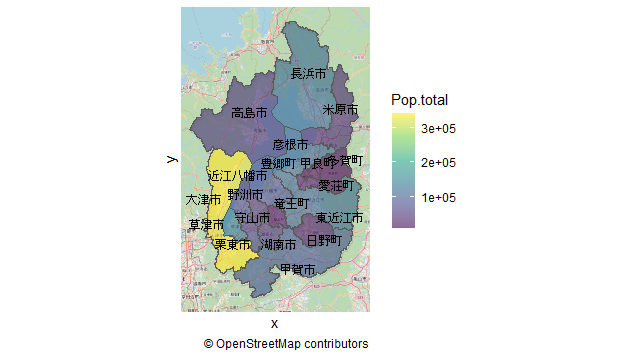
滋賀県の市区町村を人口別に塗りつぶしてみます。境界の描画は「地図で見る統計(統計GIS)」の「25000 滋賀県全域 世界測地系緯度経度・Shapefile」から取得します。
library(ggplot2)
library(ggrepel)
library(sf)
library(tidyverse)
library(kableExtra)
library(ggspatial)

map <- read_sf("shp/h27ka25.shp") # 滋賀県のシェープファイル

dat <- map %>%
  group_by(CITY_NAME) %>% # 市名でグルーピング
  summarize('Pop.total' = sum(JINKO))  %>% # グループ単位で領域結合, 人口計算
  mutate( # 重心計算と座標値の抽出
    centroid = st_centroid(geometry),
    x = st_coordinates(centroid)[, 1],
    y = st_coordinates(centroid)[, 2]
  ) %>%
  arrange(desc(Pop.total))

dat %>%
  ggplot() +
  annotation_map_tile(zoomin = 0) +
  geom_sf(aes(fill = Pop.total)) +  # 人口毎に色分け
  coord_sf(datum = NA) +
  scale_fill_viridis_c(alpha = 0.6) +
  theme_void()+
  geom_text_repel(aes(x = x, y = y, label = CITY_NAME), col="black",
                  family = "JP4", size = 3) +
  labs(caption = "\U00a9 OpenStreetMap contributors") +
  theme_minimal()


table_df<-data.frame(市区町村=dat$CITY_NAME, 人口=dat$Pop.total)

library(clipr)
table_df %>%
  kable(align = "c", row.names=FALSE) %>%
  kable_styling(full_width = F) %>%
  column_spec(1, bold = T) %>%
  collapse_rows(columns = 1, valign = "middle") %>%
  write_clip
| 市区町村 | 人口 |
|---|---|
| 大津市 | 340973 |
| 草津市 | 137247 |
| 長浜市 | 118193 |
| 東近江市 | 114180 |
| 彦根市 | 113679 |
| 甲賀市 | 90901 |
| 近江八幡市 | 81312 |
| 守山市 | 79859 |
| 栗東市 | 66749 |
| 湖南市 | 54289 |
| 高島市 | 50025 |
| 野洲市 | 49889 |
| 米原市 | 38719 |
| 日野町 | 21873 |
| 愛荘町 | 20778 |
| 竜王町 | 12434 |
| 豊郷町 | 7422 |
| 多賀町 | 7355 |
| 甲良町 | 7039 |