【R】奈良県の人口別コロプレス図
2020年8月21日
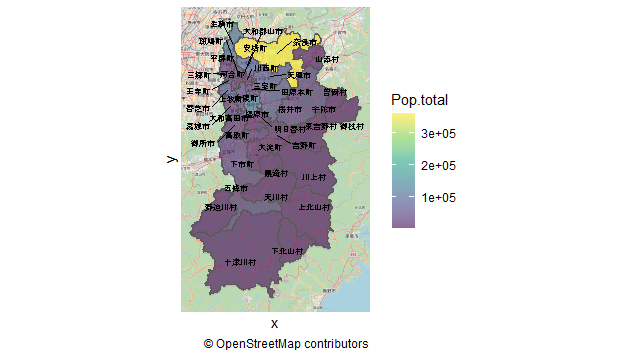
奈良県の市区町村を人口別に塗りつぶしてみます。境界の描画は「地図で見る統計(統計GIS)」の「29000 奈良県全域 世界測地系緯度経度・Shapefile」から取得します。
library(ggplot2)
library(ggrepel)
library(sf)
library(tidyverse)
library(kableExtra)
library(ggspatial)

map <- read_sf("shp/h27ka29.shp") # 奈良県のシェープファイル

dat <- map %>%
  group_by(CITY_NAME) %>% # 市名でグルーピング
  summarize('Pop.total' = sum(JINKO))  %>% # グループ単位で領域結合, 人口計算
  mutate( # 重心計算と座標値の抽出
    centroid = st_centroid(geometry),
    x = st_coordinates(centroid)[, 1],
    y = st_coordinates(centroid)[, 2]
  ) %>%
  arrange(desc(Pop.total))

dat %>%
  ggplot() +
  annotation_map_tile(zoomin = 0) +
  geom_sf(aes(fill = Pop.total)) +  # 人口毎に色分け
  coord_sf(datum = NA) +
  scale_fill_viridis_c(alpha = 0.6) +
  theme_void()+
  geom_text_repel(aes(x = x, y = y, label = CITY_NAME), col="black",
                  family = "JP4", size = 2) +
  labs(caption = "\U00a9 OpenStreetMap contributors") +
  theme_minimal()


table_df<-data.frame(市区町村=dat$CITY_NAME, 人口=dat$Pop.total)

library(clipr)
table_df %>%
  kable(align = "c", row.names=FALSE) %>%
  kable_styling(full_width = F) %>%
  column_spec(1, bold = T) %>%
  collapse_rows(columns = 1, valign = "middle") %>%
  write_clip
| 市区町村 | 人口 |
|---|---|
| 奈良市 | 360310 |
| 橿原市 | 124111 |
| 生駒市 | 118233 |
| 大和郡山市 | 87050 |
| 香芝市 | 77561 |
| 天理市 | 67398 |
| 大和高田市 | 64817 |
| 桜井市 | 57244 |
| 葛城市 | 36635 |
| 広陵町 | 33487 |
| 田原本町 | 31691 |
| 宇陀市 | 31105 |
| 五條市 | 30997 |
| 斑鳩町 | 27303 |
| 御所市 | 26868 |
| 三郷町 | 23571 |
| 王寺町 | 23025 |
| 上牧町 | 22054 |
| 平群町 | 18883 |
| 大淀町 | 18069 |
| 河合町 | 17941 |
| 川西町 | 8485 |
| 安堵町 | 7443 |
| 吉野町 | 7399 |
| 高取町 | 7195 |
| 三宅町 | 6836 |
| 下市町 | 5664 |
| 明日香村 | 5523 |
| 山添村 | 3674 |
| 十津川村 | 3508 |
| 御杖村 | 1759 |
| 東吉野村 | 1745 |
| 曽爾村 | 1549 |
| 天川村 | 1354 |
| 川上村 | 1313 |
| 下北山村 | 895 |
| 黒滝村 | 660 |
| 上北山村 | 512 |
| 野迫川村 | 449 |