【R】地図にポイントデータを追加
Rで描いた地図にある地点のポイントを表示しようとしてなかなかできなかったので、記録として残しておきます。
「データフレーム上の緯度と経度を空間オブジェクトに変換する-🦉sfと🐍geopandasの例-」のサイトを参考にさせていただきました。
データは、Ames housing data set (De Cock 2011)を使用します。Iowaの住宅について、部屋の広さとか住所とかと価格がまとまっています。機械学習等のデータとしてよく使われているようです。今回は、このデータから緯度・経度座標をとってきて、地図に表示させます。
Iowa州のシェープファイルは、「IOWA GEODATA」からダウンロードして使いました。
Ames housing data set は、modeldataパッケージにあります。他のライブラリも読み込んでおきます。
library(ggplot2)
library(sf)
library(tidyverse)
library(modeldata)
library(ggrepel)

data(ames)
こんな、データで74の変数に対して2930のデータがあります。
> ames
# A tibble: 2,930 x 74
   MS_SubClass MS_Zoning Lot_Frontage Lot_Area Street Alley Lot_Shape Land_Contour
   <fct>       <fct>            <dbl>    <int> <fct>  <fct> <fct>     <fct>
 1 One_Story_~ Resident~          141    31770 Pave   No_A~ Slightly~ Lvl
 2 One_Story_~ Resident~           80    11622 Pave   No_A~ Regular   Lvl
 3 One_Story_~ Resident~           81    14267 Pave   No_A~ Slightly~ Lvl
 4 One_Story_~ Resident~           93    11160 Pave   No_A~ Regular   Lvl
 5 Two_Story_~ Resident~           74    13830 Pave   No_A~ Slightly~ Lvl
 6 Two_Story_~ Resident~           78     9978 Pave   No_A~ Slightly~ Lvl
 7 One_Story_~ Resident~           41     4920 Pave   No_A~ Regular   Lvl
 8 One_Story_~ Resident~           43     5005 Pave   No_A~ Slightly~ HLS
 9 One_Story_~ Resident~           39     5389 Pave   No_A~ Slightly~ Lvl
10 Two_Story_~ Resident~           60     7500 Pave   No_A~ Regular   Lvl
# ... with 2,920 more rows, and 66 more variables: Utilities <fct>,
#   Lot_Config <fct>, Land_Slope <fct>, Neighborhood <fct>, Condition_1 <fct>,
#   Condition_2 <fct>, Bldg_Type <fct>, House_Style <fct>, Overall_Cond <fct>,
#   Year_Built <int>, Year_Remod_Add <int>, Roof_Style <fct>, Roof_Matl <fct>,
#   Exterior_1st <fct>, Exterior_2nd <fct>, Mas_Vnr_Type <fct>, Mas_Vnr_Area <dbl>,
#   Exter_Cond <fct>, Foundation <fct>, Bsmt_Cond <fct>, Bsmt_Exposure <fct>,
#   BsmtFin_Type_1 <fct>, BsmtFin_SF_1 <dbl>, BsmtFin_Type_2 <fct>,
#   BsmtFin_SF_2 <dbl>, Bsmt_Unf_SF <dbl>, Total_Bsmt_SF <dbl>, Heating <fct>,
#   Heating_QC <fct>, Central_Air <fct>, Electrical <fct>, First_Flr_SF <int>,
#   Second_Flr_SF <int>, Gr_Liv_Area <int>, Bsmt_Full_Bath <dbl>,
#   Bsmt_Half_Bath <dbl>, Full_Bath <int>, Half_Bath <int>, Bedroom_AbvGr <int>,
#   Kitchen_AbvGr <int>, TotRms_AbvGrd <int>, Functional <fct>, Fireplaces <int>,
#   Garage_Type <fct>, Garage_Finish <fct>, Garage_Cars <dbl>, Garage_Area <dbl>,
#   Garage_Cond <fct>, Paved_Drive <fct>, Wood_Deck_SF <int>, Open_Porch_SF <int>,
#   Enclosed_Porch <int>, Three_season_porch <int>, Screen_Porch <int>,
#   Pool_Area <int>, Pool_QC <fct>, Fence <fct>, Misc_Feature <fct>,
#   Misc_Val <int>, Mo_Sold <int>, Year_Sold <int>, Sale_Type <fct>,
#   Sale_Condition <fct>, Sale_Price <int>, Longitude <dbl>, Latitude <dbl>
このデータから、地図の描画に必要なMS_Zoning, Longitude, Latitudeのみを抽出して、地図に描けるように準備します。
dat <- ames %>%
  select(MS_Zoning, Longitude, Latitude) %>%
  sfheaders::sf_point(x = "Longitude", y = "Latitude", keep = TRUE) %>%
  st_set_crs(4326)
sfheaderを使って変換していますが、最初はこれが分からず苦労しました。。。
ベースとなる地図のデータを準備します。
map <- read_sf("county_Iowa/county.shp")
早速、地図に描いてみます。
map %>%
  ggplot() +
  geom_sf(fill="white") +
  geom_sf(data = dat,
          aes(color = MS_Zoning)) +
  coord_sf(datum = NA)
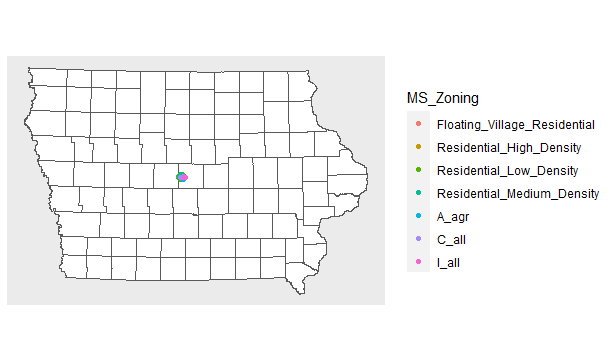
Ames housingのデータは、表示はされましたが、これでは全く分からないので、拡大してみます。Countyで区切ればいいかな?
map %>%
  mutate( # 重心計算と座標値の抽出
  centroid = st_centroid(geometry),
      x = st_coordinates(centroid)[, 1],
      y = st_coordinates(centroid)[, 2]
    ) %>%
  ggplot() +
  geom_sf(fill="white") +
  geom_sf(data = dat,
          aes(color = MS_Zoning)) +
  coord_sf(datum = NA) +
  geom_text_repel(aes(x = x, y = y, label = COUNTY), col = "orange", size = 4)
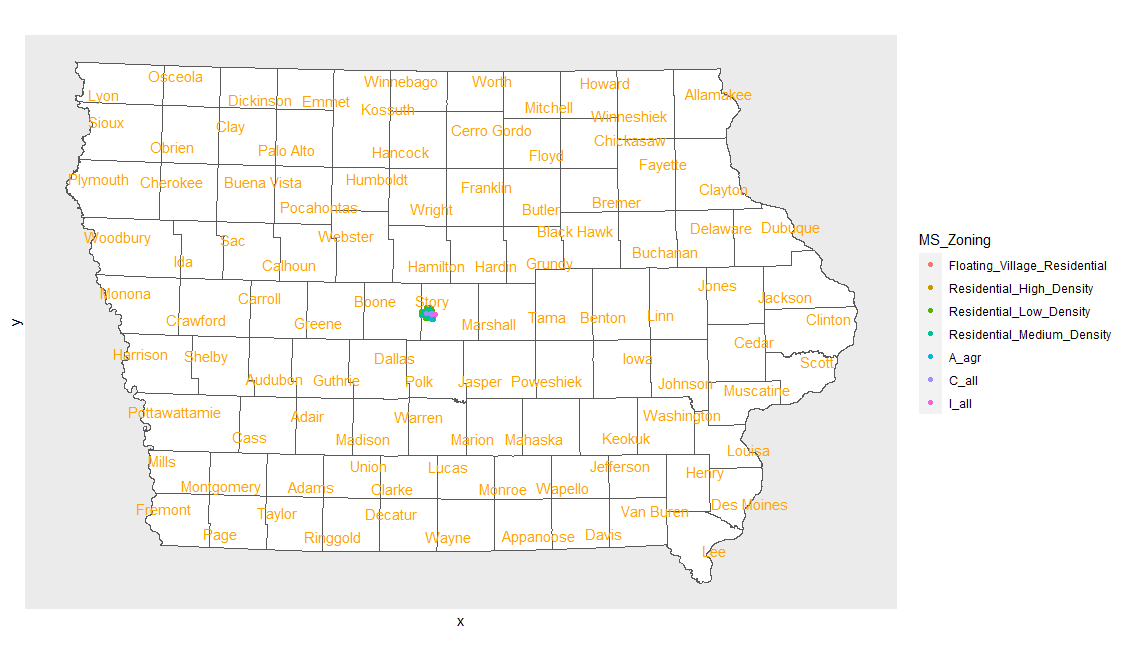
よし、Storyを拡大しよう!
map %>%
  filter(COUNTY=="Story") %>%
  ggplot() +
  geom_sf(fill="white") +
  geom_sf(data = dat,
          aes(color = MS_Zoning)) +
  coord_sf(datum = NA)
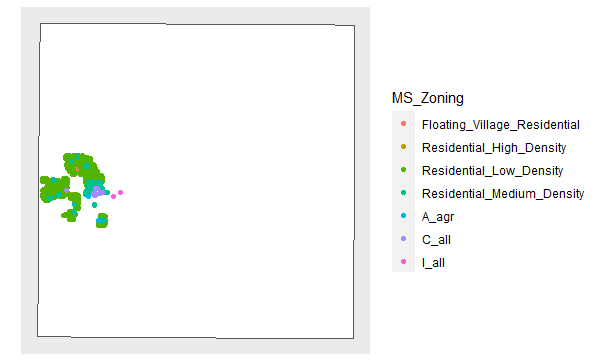
これでもよくわからないし、そもそも背景が白になってしまい、ベースの地図を描く意味がない。。。
結局、これにしました。
mapview::mapview(dat)
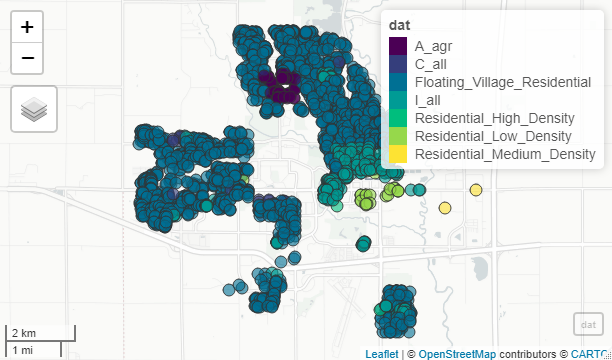
インタラクティブな地図だし。。。
実は、この地図を描こうと思ったのは、「Tidy Modeling with R」で機械学習の勉強をしていて、地図が出てきたのですが、この描き方がわからなかったから(コードもなかったから)です。でも、今回は、地図を描く勉強になってよかったです。
