【R】日本の都市を表示
2020年11月15日
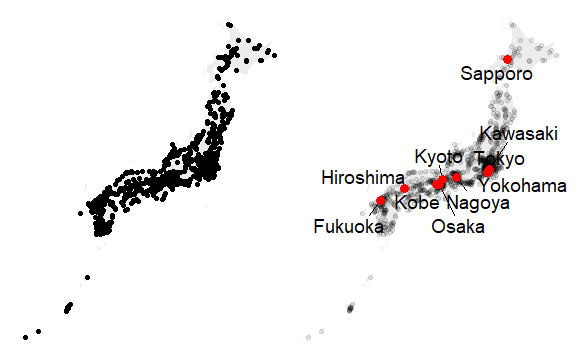
日本の都市を表示してみます。
”Bubble map with ggplot2”を参考にさせていただきました。
library(ggplot2)
library(tidyverse)
library(ggrepel)
library(maps)
library(patchwork)

JP <- map_data("world") %>% filter(region=="Japan")

data <- world.cities %>% filter(country.etc=="Japan")

g1 <- ggplot() +
  geom_polygon(data = JP, aes(x=long, y = lat, group = group), fill="grey", alpha=0.3) +
  geom_point( data=data, aes(x=long, y=lat)) +
  theme_void()

g2 <- ggplot() +
  geom_polygon(data = JP, aes(x=long, y = lat, group = group), fill="grey", alpha=0.3) +
  geom_point( data=data, aes(x=long, y=lat, alpha=pop)) +
  geom_text_repel( data=data %>% arrange(pop) %>% tail(10), aes(x=long, y=lat, label=name), size=5) +
  geom_point( data=data %>% arrange(pop) %>% tail(10), aes(x=long, y=lat), color="red", size=3) +
  theme_void() +
  theme(legend.position="none")

g1 | g2
ついでに、Fiji周辺の地震のデータを表示させる例があったので、こちらも試してみました。
library(leaflet)

data(quakes)

mybins <- seq(4, 6.5, by=0.5)
mypalette <- colorBin( palette="RdYlGn", domain=quakes$mag, na.color="transparent", bins=mybins)

mytext <- paste(
  "Depth: ", quakes$depth, "<br/>",
  "Stations: ", quakes$stations, "<br/>",
  "Magnitude: ", quakes$mag, sep="") %>%
  lapply(htmltools::HTML)

m <- leaflet(quakes) %>%
  addTiles()  %>%
  setView( lat=-27, lng=170 , zoom=4) %>%
  addProviderTiles("Esri.WorldImagery") %>%
  addCircleMarkers(~long, ~lat,
                   fillColor = ~mypalette(mag), fillOpacity = 0.7, color="white", radius=~depth/100, stroke=FALSE,
                   label = mytext,
                   labelOptions = labelOptions( style = list("font-weight" = "normal", padding = "3px 8px"), textsize = "13px", direction = "auto")
  ) %>%
  addLegend( pal=mypalette, values=~mag, opacity=0.9, title = "Magnitude", position = "bottomright" )

m

