【R】OpenStreetMapからデータ取得で地図を描く
2020年12月21日
タイトルの通り、OpenStreetMapからデータを取得して、ggplotを使って地図を描きます。こちらのサイトを参考にさせていただきました。
osmdataパッケージを使います。OSMは、すべての物体をfeatureとして保存してあります。このfeatureはkeyとvalueのペアで紐づけされています。例えば、highwayというkeyにどんなvalueがあるか、調べるとこうなります。
library(tidyverse)
library(osmdata)

available_tags("highway")
[1] "bridleway"    "bus_guideway" "bus_stop"     "construction" "corridor"
[6] "crossing"
こんな感じに表示されます。
では、どんなfeatureがあるか調べてみます。
available_features()
[1] "4wd only" "abandoned" "abutters" "access" "addr" "addr:city"ずらずらずらっと表示されます。
仙台の地図を描いてみます。仙台の座標を調べます。
getbb("Sendai Japan")
> getbb("Sendai Japan")
        min      max
x 140.46947 141.2603
y  38.05085  38.4547
道路の情報を取得します。
streets <- getbb("Sendai Japan")%>%
  opq()%>%
  add_osm_feature(key = "highway",
                  value = c("motorway", "primary",
                            "secondary", "tertiary")) %>%
  osmdata_sf()
streets
Object of class 'osmdata' with:
                 $bbox : 38.0508487,140.469472,38.454699,141.2603046
        $overpass_call : The call submitted to the overpass API
                 $meta : metadata including timestamp and version numbers
           $osm_points : 'sf' Simple Features Collection with 79396 points
            $osm_lines : 'sf' Simple Features Collection with 7797 linestrings
         $osm_polygons : 'sf' Simple Features Collection with 10 polygons
       $osm_multilines : 'sf' Simple Features Collection with 10 multilinestrings
    $osm_multipolygons : NULL
続けて、小道、川、電車の線路の情報を取得します。
small_streets <- getbb("Sendai Japan")%>%
  opq()%>%
  add_osm_feature(key = "highway",
                  value = c("residential", "living_street",
                            "unclassified",
                            "service", "footway")) %>%
  osmdata_sf()

river <- getbb("Sendai Japan")%>%
  opq()%>%
  add_osm_feature(key = "waterway", value = "river") %>%
  osmdata_sf()

railway <- getbb("Sendai Japan")%>%
  opq()%>%
  add_osm_feature(key = "railway", value = c("rail", "subway")) %>%
  osmdata_sf()
これらの情報をまとめて地図にします。
ggplot() +
  geom_sf(data = streets$osm_lines,
          inherit.aes = FALSE,
          color = "#7fc0ff",
          size = .4,
          alpha = .8) +
  geom_sf(data = small_streets$osm_lines,
          inherit.aes = FALSE,
          color = "#ffbe7f",
          size = .2,
          alpha = .6) +
  geom_sf(data = river$osm_lines,
          inherit.aes = FALSE,
          color = "#ffbe7f",
          size = .2,
          alpha = .5) +
  geom_sf(data = railway$osm_lines,
          inherit.aes = FALSE,
          color = "#ff007f",
          size = .2,
          alpha = .5) +
  coord_sf(xlim = c(140.47, 141.3),
           ylim = c(38, 38.5),
           expand = FALSE) +
  theme_void() +
  theme(    plot.background = element_rect(fill = "#282828")  )
で、出来上がった地図がこちら。
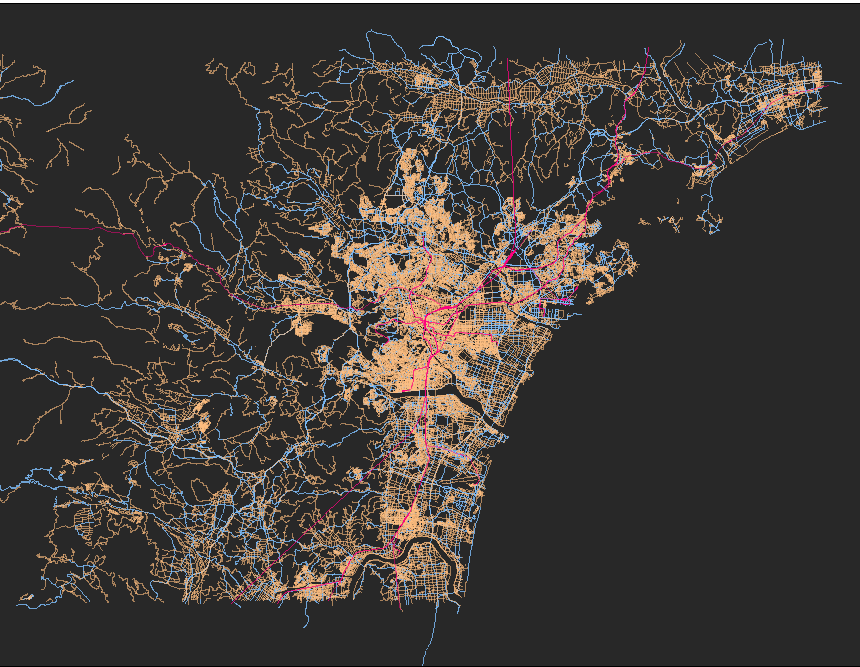
おもしろい!けど、ごちゃごちゃしすぎだな。小道はいらなかったか?
