【R】ggmosaic
2020年12月28日
1. はじめに
ggmosaicは、カテゴリカルデータの可視化のためのパッケージで、ggplotを使ってbar chart, stacked bar chart, mosaic plotやdouble decker plotができます。
2. インストール
Githubからインストールします。
devtools::install_github("haleyjeppson/ggmosaic")3. 使ってみる
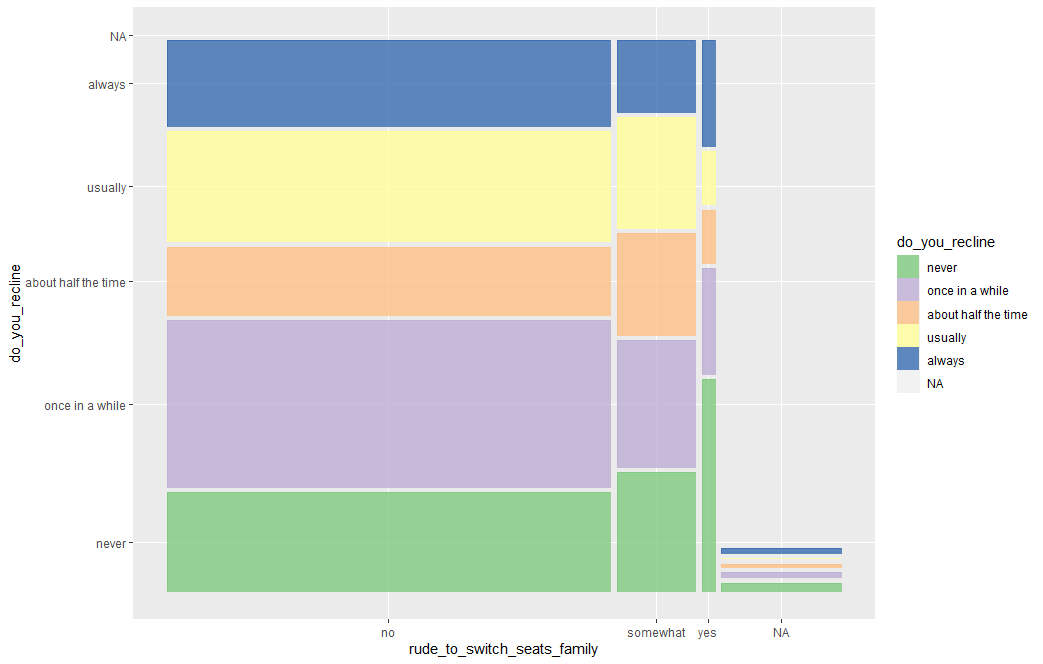
library(ggmosaic)

data(fly)
ggplot(fly) +
  geom_mosaic(aes(x = product(rude_to_switch_seats_family), fill=do_you_recline))+
  scale_fill_brewer(palette = "Accent")
4. さいごに
キレイに簡単に描けますね。
