【R】Primary care center
2021年1月3日
1. はじめに
Covid-19が猛威を振るっていますが、その人口当たりのPrimary care centerの数も看病・治療には重要になってきます。この騒動で多くの富裕層はリゾート地へ避難しているようですが、医療体制は十分でしょうか?マイアミの状況を見てみます。
2. みてみる
こちらのサイトを参考に、人口当たりのPrimary Care Centerの数を表示してみます。
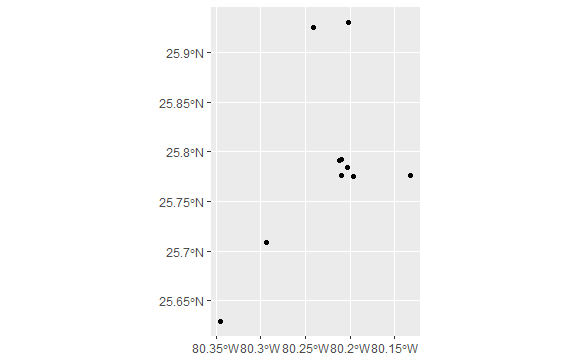
まずは、データを取得します。ArcGIS Hubのサイトから「Jackson Primary Care Center」のデータを取得します。取得には、geojsonを利用します。
library(tidyverse)
library(geojsonsf)
library(sf)

pc_centers_url <- "https://opendata.arcgis.com/datasets/0ec354f26cee4215b0a89c0bea0d399b_0.geojson"

pc_centers <- geojsonsf::geojson_sf(pc_centers_url)

pc_centers %>%
  ggplot() +
  geom_sf()
データを整形して地図へプロットしてみます。
library(tidycensus)
pop <- tidycensus::get_acs(geography = "tract",
year = 2018,
state = 12,
county = 086,
survey = "acs5",
variables = "B01001_001",
geometry = T,
output = "tidy", )
pop_cl <- pop %>%
sf::st_transform(crs = 3559) %>%
mutate(area = sf::st_area(geometry) %>% units::set_units(mi^2),
density = as.numeric(estimate/area))
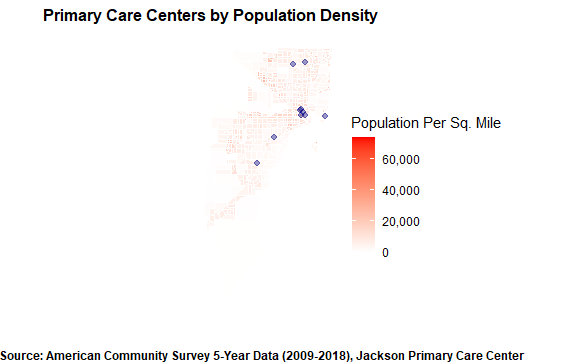
pc_density_map <- pop_cl %>%
ggplot(aes(fill = density)) +
geom_sf(color = "white") +
geom_sf(data = pc_centers, inherit.aes = T,
color = "navy", stroke = 1, fill = "navy", alpha = .4) +
scale_fill_gradient(low = "white", high = "red",
labels = scales::comma_format(accuracy = 1)) +
labs(title = "Primary Care Centers by Population Density",
fill = "Population Per Sq. Mile",
caption = "Source: American Community Survey 5-Year Data (2009-2018), Jackson Primary Care Center") +
theme_void() +
theme(plot.title = element_text(face = "bold", size = 12, hjust = .5),
plot.caption = element_text(face = "bold", hjust = .3))
pc_density_map