【R】qqboxplot
2021年5月16日
1. はじめに
qqboxplotは、ggplotでboxplotを拡張するパッケージです。
2. インストール
CRANからインストールできます。
install.packages("qqboxplot")3. つかってみる
library(dplyr)
library(ggplot2)
library(qqboxplot)
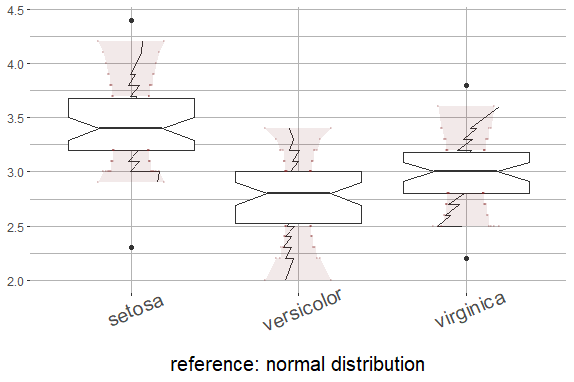
iris %>%
ggplot(aes(factor(Species), Sepal.Width)) +
geom_qqboxplot(notch=TRUE, varwidth = TRUE, reference_dist="norm") +
xlab("reference: normal distribution") +
ylab(NULL) +
guides(color=FALSE) +
theme(axis.text.x = element_text(angle = 23, size = 15), axis.title.y = element_text(size=15),
axis.title.x = element_text(size=15),
panel.border = element_blank(), panel.background = element_rect(fill="white"),
panel.grid = element_line(colour = "grey70"))
4. さいごに
boxplot関連のパッケージはたくさんありますよね。
