【R】rKenyaCensus
2021年1月21日
1. はじめに
rKenyaCensusは、2019年のKenya Population and Housing Censusの結果をtidyにまとめたデータセットです。
2. インストール
CRANからインストールできないようなので、Githubからインストールします。
devtools::install_github("Shelmith-Kariuki/rKenyaCensus")3. つかってみる
どんなデータがあるかは、以下で確認できます。
library(rKenyaCensus)
data("DataCatalogue")
> force(DataCatalogue)
Dataset Volume Table.No.in.PDFs
1 DataCatalogue
2 CountyGPS
3 KenyaCounties_SHP
4 V1_T2.1 V1 Table 2. 1
5 V1_T2.2 V1 Table 2. 2
6 V1_T2.3 V1 Table 2. 3
7 V1_T2.4 V1 Table 2. 4
8 V1_T2.5 V1 Table 2. 5
9 V1_T2.6 V1 Table 2. 6
10 V1_T2.7 V1 Table 2. 7
11 V2_T1.1 V2 Table 1.1
12 V2_T1.2 V2 Table 1.2
13 V2_T2.1 V2 Table 2.1
14 V2_T2.2 V2 Table 2.2
15 V2_T2.2a V2 Table 2.2a
16 V2_T2.2b V2 Table 2.2b
17 V2_T2.3 V2 Table 2.3
18 V2_T2.5 V2 Table 2.5
19 V3_T1.1 V3 Table 1.1
20 V3_T1.2 V3 Table 1.2
21 V3_T2.1 V3 Table 2.1
22 V3_T2.2 V3 Table 2.2
23 V3_T2.2a V3 Table 2.2a
24 V3_T2.2b V3 Table 2.2b
25 V3_T2.3 V3 Table 2.3
26 V3_T2.4a V3 Table 2.4a
27 V3_T2.4b V3 Table 2.4b
28 V4_T1.1 V4 Table 1. 1
29 V4_T1.9 V4 Table 1.9
30 V4_T2.2 V4 Table2.2
31 V4_T2.3 V4 Table 2.3
32 V4_T2.4 V4 Table 2.4
33 V4_T2.5 V4 Table 2.5
34 V4_T2.6a V4 Table 2.6a
35 V4_T2.6b V4 Table 2.6b
36 V4_T2.7 V4 Table 2.7
37 V4_T2.8a V4 Table 2.8a
38 V4_T2.8b V4 Table 2.8b
39 V4_T2.8c V4 Table 2.8c
40 V4_T2.9a V4 Table 2.9a
41 V4_T2.9b V4 Table 2.9b
42 V4_T2.9c V4 Table 2.9c
43 V4_T2.10 V4 Table 2.10
44 V4_T2.11a V4 Table 2.11a
45 V4_T2.11b V4 Table 2.11b
46 V4_T2.12 V4 Table 2.12
47 V4_T2.13 V4 Table 2.13
48 V4_T2.14 V4 Table 2.14
49 V4_T2.15 V4 Table 2.15
50 V4_T2.16 V4 Table 2.16
51 V4_T2.17 V4 Table 2.17
52 V4_T2.18 V4 Table 2.18
53 V4_T2.19 V4 Table 2.19
54 V4_T2.20 V4 Table 2.20
55 V4_T2.21 V4 Table 2.21
56 V4_T2.22 V4 Table 2.22
57 V4_T2.23 V4 Table 2.23
58 V4_T2.24 V4 Table 2.24
59 V4_T2.25 V4 Table 2.25
60 V4_T2.26 V4 Table 2.26
61 V4_T2.27 V4 Table 2.27
62 V4_T2.28 V4 Table 2.28
63 V4_T2.29 V4 Table 2.29
64 V4_T2.30 V4 Table 2.30
65 V4_T2.31 V4 Table 2.31
66 V4_T2.32 V4 Table 2.32
67 V4_T2.33 V4 Table 2.33
68 V4_T2.34 V4 Table 2.34
69 V4_T2.35 V4 Table 2.35
70 V4_T2.36 V4 Table 2.36
71 V4_T2.37 V4 Table 2.37
72 V4_T2.38 V4 Table 2.38
73 V4_T2.39 V4 Table 2.39
74 V4_T2.40 V4 Table 2.40
Dataset.Description
1 Shows the table number for each of the datasets
2 Shows the County GPS centroids
3 Shapefiles of Kenya County boundaries
4 Census Indicators at a Glance, 2019
5 Distribution of Population by Sex and County
6 Distribution of Population, Number of Households and Average
7 Distribution of Population, Land Area and Population Density by County
8 Distribution of Population by Sex and Sub-County
9 Distribution of Population, Number of Households and Average Household Size by Sub- County
10 Distribution of Population by Land Area and Population Density by Sub-County
11 Summary of Census Counts in Kenya
12 List of Counties and Sub-Counties
13 Sub-locations with no People on the Census Night by Status/Reason
14 Distribution of Population by Sex, Number of Households, Land Area, Population Density and County
15 Distribution of Rural Population by Sex, Number of Households, Land Area, Population Density and County
16 Distribution of Urban Population by Sex, Number of Households, Land Area, Population Density and County
17 Distribution of Population by Sex, Number of Households, Land Area, Population Density and Sub County
18 Distribution of Population by Urban Centres, Sex and County
19 Summary of Census Counts in Kenya
20 List of Counties and Sub-Counties
21 Sub-locations with no People on the Census Night by Status/Reason
22 Distribution of Population by Age and Sex, Kenya
23 Distribution of Rural Population by Age and Sex, Kenya
24 Distribution of Urban Population by Age and Sex, Kenya
25 Distribution of Population by Age, Sex, County and Sub- County
26 Distribution of Rural Population by Age, Sex and County
27 Distribution of Urban Population by Age, Sex and County
28 Summary of Census Counts in Kenya.
29 List of Counties and Sub-Counties
30 Distribution of Population Aged 3 Years and Above by School Attendance Status, Area of Residence, Sex, County and SubCounty.
31 Distribution of Population Aged 3 Years and Above Currently Attending School/ Learning Institution by Education Level, Area of Residence, Sex, County and Sub-County
32 Distribution of Population Aged 3 Years and Above by Highest Level of Education Reached, Area of Residence, Sex, County and Sub-County..
33 Distribution of Population Aged 3 Years and Above by Highest Level of Education Completed, Area of Residence, Sex, County and Sub-County..
34 Distribution of Population Aged 3 Years and Above by School Attendance Status, Sex and Special Age Groups
35 Distribution of Population Aged 3 Years and Above by School Attendance Status, Sex, Special Age Groups and County..
36 Distribution of Population Aged 15 years and Above by Sex and Main Training Acquired and Qualified for
37 Distribution of Population Aged 5 Years and above by Activity Status, Sex, County and Sub-County
38 Distribution of Urban Population Aged 5 Years and above by Activity Status, Sex, County and Sub-County.....
39 Distribution of Rural Population Aged 5 Years and above by Activity Status, Sex, County and Sub-County..
40 Distribution of Population Aged 5 years and above by Activity Status, Broad Age Groups and County..
41 Distribution of Rural Population Aged 5 years and above by Activity Status, Broad Age Groups and County.......
42 Distribution of Urban Population Aged 5 years and above by Activity Status, Broad Age Groups and County.......
43 Distribution of Households and Tenure Status of Main Dwelling Unit by Area of Residence, County and Sub-County
44 Distribution of Households Owning the Main Dwelling Unit by Mode of Acquisition, Area of Residence, County and Sub-County
45 Distribution of Households Renting/Provided with their Main Tenure Status of Main Dwelling Unit by Provider, Area of Residence, County and Sub- County..
46 Percentage Distribution of Conventional Households by Dominant Roofing Material of Main Dwelling Unit, Area of Residence, County and Sub-County.....
47 Percentage Distribution of Conventional Households by Dominant Wall Material of Main Dwelling Unit, Area of Residence, County and Sub-County.......
48 Percentage Distribution of Conventional Households by Dominant Floor Material of the Main Dwelling Unit, Area of Residence, County and Sub County......
49 Percentage Distribution of Conventional Households by Main Source of Drinking Water, Area of Residence, County and Sub-County..
50 Percentage Distribution of Conventional Households by Main Mode of Human Waste Disposal, Area of Residence, County and Sub-County..
51 Percentage Distribution of Conventional Households by Main Mode of Solid Waste Disposal, Area of Residence, County and Sub-County..
52 Percentage Distribution of Conventional Households by Main Type of Cooking Fuel, Area of Residence, County and Sub-County....
53 Percentage Distribution of Conventional Households by Main Type of Lighting Fuel, Area of Residence, County and Sub-County....
54 Distribution of households practicing Agriculture, Fishing and Irrigation by County and Sub County.
55 Distribution of Households Growing Permanent Crops by Type and County.
56 Distribution of Households Growing Other Crops by Type, County and Sub County
57 Distribution of Households Rearing Livestock and Fish by County and Sub County.
58 Distribution of Livestock population by type, Fish Ponds and Fish Cages by County and Sub County..
59 Distribution of area (hectares) of Agricultural land and Farming Households by purpose of production, County and Sub-County..
60 Distribution of Population aged 5 years and above by Disability Status, Sex1, Area of Residence, County and Sub-County....
61 Distribution of Persons with Disability by Type of Disability, Sex1, Area of Residence, County and Sub County...
62 Distribution of Persons with Albinism by Sex1, Area of Residence, County and Sub County..
63 Population of Street Persons/Outdoor Sleepers by Sex1, Area of Residence and County.
64 Distribution of Population by Religious Affiliation and County
65 Distribution of Population by Ethnicity/Nationality
66 Distribution of Population Age 3 years and Above Owning a Mobile Phone by Area of Residence, Sex, County and Sub County
67 Distribution of Population Age 3 Years and Above Using Internet and Computer/Laptop/Tablet by Area of Residence, Sex, County and Sub-County...
68 Distribution of Population age 15 years and above who Searched and Bought Goods and Services Online by Area of Residence, Sex, County and Sub-County.
69 Distribution of Population Age 3 years and Above who owned and used Selected ICT Equipment and Service by Age, Area of Residence and County..
70 Percentage Distribution of Conventional Households by Ownership of Selected Household Assets by Area of Residence, County and Sub County...
71 Births in the Last 12 months* by place of Occurrence and County...
72 Births in the Last 5 Years* by place of Occurrence and County
73 Notified Births in the Last 12 months by County
74 Notified Births in the Last 5 Years by Countyデータを次のように展開します。
df <- V1_T2.2
head(df)
> head(df)
# A tibble: 6 x 5
County Male Female Intersex Total
<chr> <dbl> <dbl> <dbl> <dbl>
1 Total 23548056 24014716 1524 47564296
2 Mombasa 610257 598046 30 1208333
3 Kwale 425121 441681 18 866820
4 Kilifi 704089 749673 25 1453787
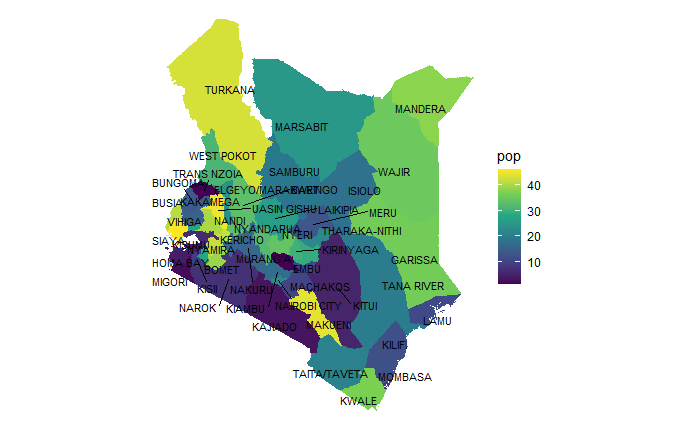
5 Tana River 158550 157391 2 315943
6 Lamu 76103 67813 4 143920人口毎に色分けしたコロプレス図を描いてみます。
library(ggplot2)
library(tidyverse)
library(ggrepel)
library(sf)
library(tidyverse)
library(kableExtra)

shp <- KenyaCounties_SHP

counties_sf <- shp %>%
  sf::st_as_sf() %>%
  mutate(
    centroid = st_centroid(geometry),
    x = st_coordinates(centroid)[, 1],
    y = st_coordinates(centroid)[, 2]
  ) %>%
  mutate(pop = as.numeric(Population)) %>%
  arrange(desc(pop))

counties_sf %>%
  ggplot(aes(fill = pop)) +
  geom_sf(color = NA) +
  scale_fill_viridis_c() +
  theme_void() +
  geom_text_repel(aes(x = x, y = y, label = County), col="black", size = 3)
人口順の表はコチラとなります。
table_df<-data.frame("County"=counties_sf$County, "Population"=counties_sf$pop)

library(clipr)
table_df %>%
  kable(align = "c", row.names=FALSE) %>%
  kable_styling(full_width = F) %>%
  column_spec(1, bold = T) %>%
  collapse_rows(columns = 1, valign = "middle") %>%
  write_clip
| County | Population |
|---|---|
| SIAYA | 46 |
| UASIN GISHU | 45 |
| MAKUENI | 44 |
| TURKANA | 43 |
| KERICHO | 42 |
| BUSIA | 41 |
| NANDI | 40 |
| BOMET | 39 |
| MANDERA | 38 |
| KWALE | 37 |
| GARISSA | 36 |
| WAJIR | 35 |
| NYERI | 34 |
| BARINGO | 33 |
| NYANDARUA | 32 |
| WEST POKOT | 31 |
| KIRINYAGA | 30 |
| EMBU | 29 |
| NYAMIRA | 28 |
| VIHIGA | 27 |
| LAIKIPIA | 26 |
| MARSABIT | 25 |
| ELGEYO/MARAKWET | 24 |
| NAIROBI CITY | 23 |
| THARAKA-NITHI | 22 |
| TAITA/TAVETA | 21 |
| TANA RIVER | 20 |
| SAMBURU | 19 |
| ISIOLO | 18 |
| KIAMBU | 17 |
| NAKURU | 16 |
| KAKAMEGA | 15 |
| BUNGOMA | 14 |
| MERU | 13 |
| KILIFI | 12 |
| LAMU | 11 |
| MACHAKOS | 10 |
| KISII | 9 |
| MOMBASA | 8 |
| NAROK | 7 |
| KISUMU | 6 |
| KITUI | 5 |
| HOMA BAY | 4 |
| KAJIADO | 3 |
| MIGORI | 2 |
| MURANG’A | 1 |
| TRANS NZOIA | 1 |
