【R】gganatogram
2021年3月4日
1. はじめに
anatogramは、生体臓器部位の位置や情報を表示するパッケージです。データはExpression Atlasから取得したようです。
2. インストール
Githubからインストールします。
devtools::install_github("jespermaag/gganatogram")Rのバージョンは4.0.4以上である必要がありそうです(ここでハマった)。
3. 使ってみる
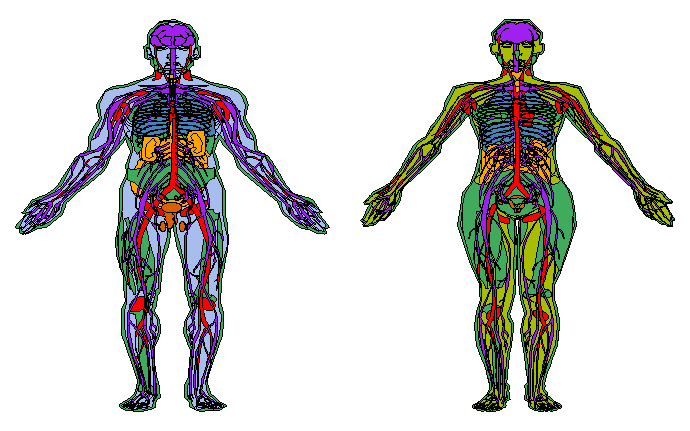
まずは、簡単な図示から。
library(gganatogram)
library(tidyverse)
library(viridis)
library(gridExtra)

Male <- gganatogram(data=hgMale_key, fillOutline='#a6bdee', organism='human', sex='male', fill="colour") + theme_void()
Female <- gganatogram(data=hgFemale_key, fillOutline='#a6bd00', organism='human', sex='female', fill="colour") + theme_void()

grid.arrange(Male, Female, ncol=2)
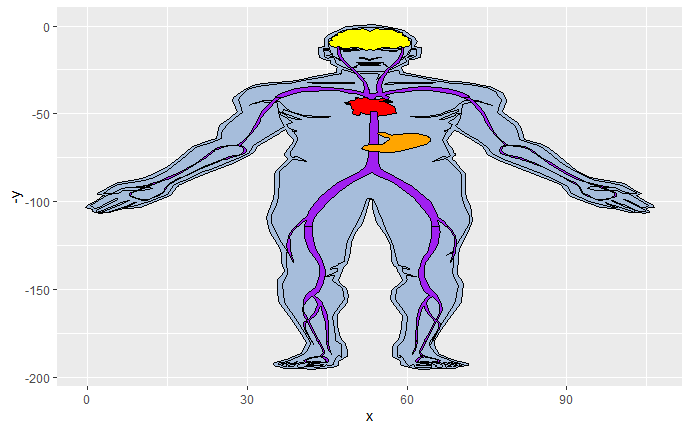
一部の臓器だけ表示させることも可能です。
organPlot <- data.frame(organ = c("heart", "leukocyte", "brain", "stomach"),
                        type = c("circulation", "circulation",  "nervous system", "digestion"),
                        colour = c("red", "purple", "yellow", "orange"),
                        value = c(10, 5, 8, 4),
                        stringsAsFactors=F)

gganatogram(data=organPlot, fillOutline='#a6bddb', organism='human', sex='male', fill="colour")
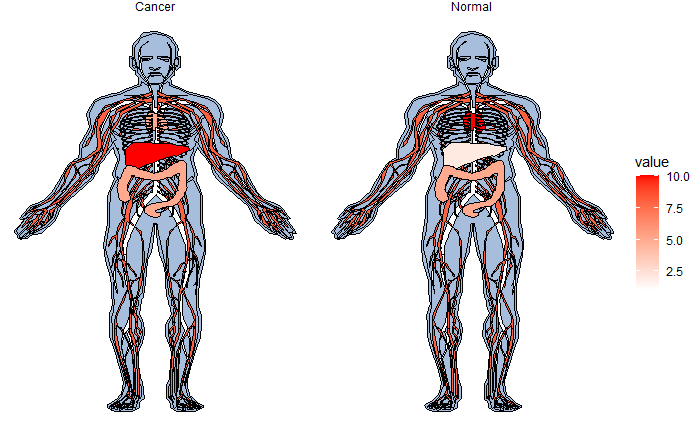
compareGroups <- rbind(data.frame(organ = c("heart", "leukocyte", "nerve", "liver", "colon"),
                                  colour = c("red", "blue", "purple", "orange", "yellow"),
                                  value = c(10, 1, 8, 2, 5),
                                  type = rep('Normal', 5),
                                  stringsAsFactors=F),
                       data.frame(organ = c("heart", "leukocyte", "nerve", "liver", "colon"),
                                  colour = c("red", "blue", "purple", "orange", "yellow"),
                                  value = c(5, 1, 8, 10, 5),
                                  type = rep('Cancer', 5),
                                  stringsAsFactors=F))

gganatogram(data=compareGroups, fillOutline='#a6bddb', organism='human', sex='male', fill="value") +
  theme_void() +
  facet_wrap(~type) +
  scale_fill_gradient(low = "white", high = "red")
4. さいごに
生体のプロットもできるなんて、すごい!
