【R】ComplexUpset
2021年3月23日
1. はじめに
ComplexUpsetは、その名の通り、複雑なグラフを描く手助けをしてくれるパッケージです。2. インストール
CRANからインストールできます。
install.packages('ComplexUpset')3. つかってみる
こちらのExampleを試してみます。
まずは、データの準備。
library(ggplot2)
library(ComplexUpset)

movies = as.data.frame(ggplot2movies::movies)

genres = colnames(movies)[18:24]

movies[movies$mpaa == '', 'mpaa'] = NA
movies = na.omit(movies)
head(movies)
> head(movies)
                         title year length   budget rating votes  r1  r2  r3   r4   r5   r6   r7   r8   r9  r10  mpaa
48          'Til There Was You 1997    113 23000000    4.8   799 4.5 4.5 4.5 14.5 14.5 14.5 14.5  4.5  4.5 14.5 PG-13
112 10 Things I Hate About You 1999     97 16000000    6.7 19095 4.5 4.5 4.5  4.5  4.5 14.5 24.5 14.5 14.5 14.5 PG-13
124              100 Mile Rule 2002     98  1100000    5.6   181 4.5 4.5 4.5  4.5 14.5 24.5 14.5 14.5  4.5 14.5     R
173             13 Going On 30 2004     98 37000000    6.4  7859 4.5 4.5 4.5  4.5  4.5 14.5 24.5 14.5  4.5 14.5 PG-13
186          13th Warrior, The 1999    102 85000000    6.1 14344 4.5 4.5 4.5  4.5 14.5 14.5 24.5 14.5  4.5  4.5     R
197                 15 Minutes 2001    120 42000000    6.1 10866 4.5 4.5 4.5  4.5 14.5 24.5 24.5 14.5  4.5  4.5     R
    Action Animation Comedy Drama Documentary Romance Short
48       0         0      1     0           0       1     0
112      0         0      1     0           0       1     0
124      0         0      1     0           0       0     0
173      0         0      1     1           0       1     0
186      1         0      0     0           0       0     0
197      0         0      0     1           0       0     0
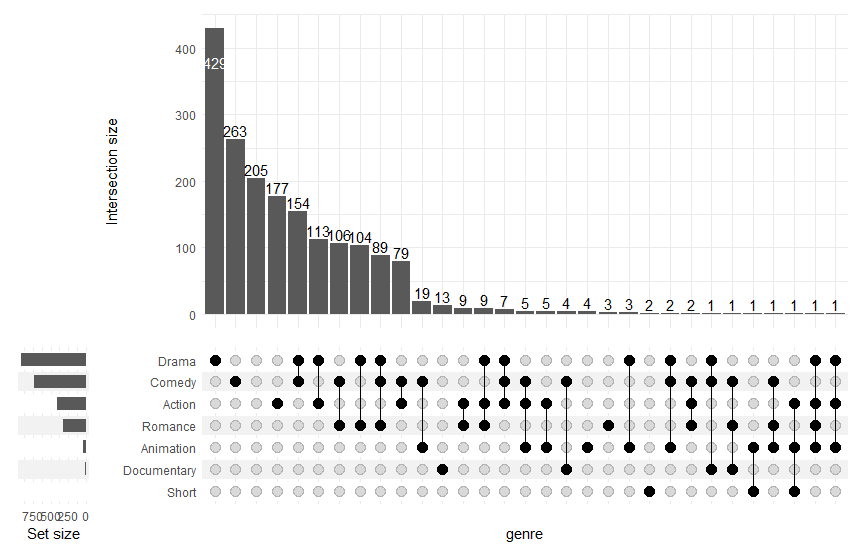
単純にプロットしてみます。
upset(movies, genres, name='genre', width_ratio=0.1)

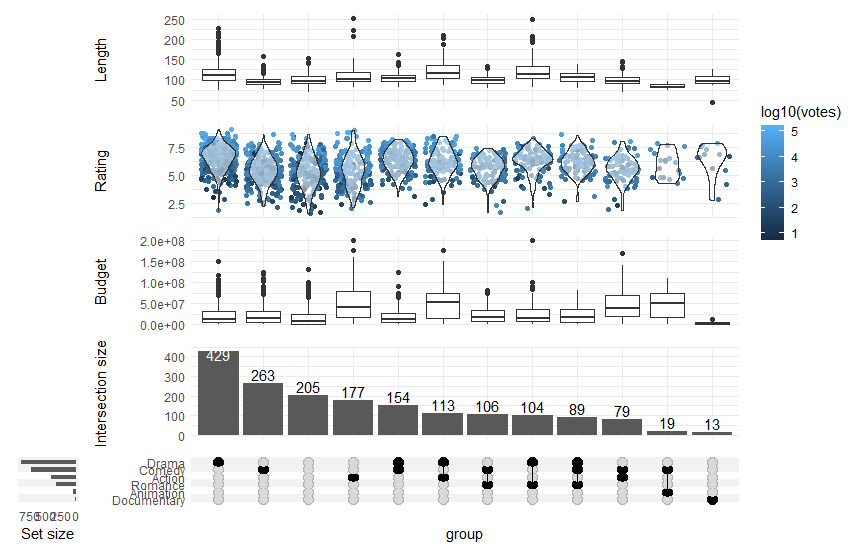
棒グラフやバイオリンプロットも加えます。
set.seed(0)

upset(
  movies,
  genres,
  annotations = list(
    'Length'=list(
      aes=aes(x=intersection, y=length),
      geom=geom_boxplot(na.rm=TRUE)
    ),
    'Rating'=(
      ggplot(mapping=aes(y=rating))
      + geom_jitter(aes(color=log10(votes)), na.rm=TRUE)
      + geom_violin(alpha=0.5, na.rm=TRUE)
    ),
    'Budget'=upset_annotate('budget', geom_boxplot(na.rm=TRUE))
  ),
  min_size=10,
  width_ratio=0.1
)

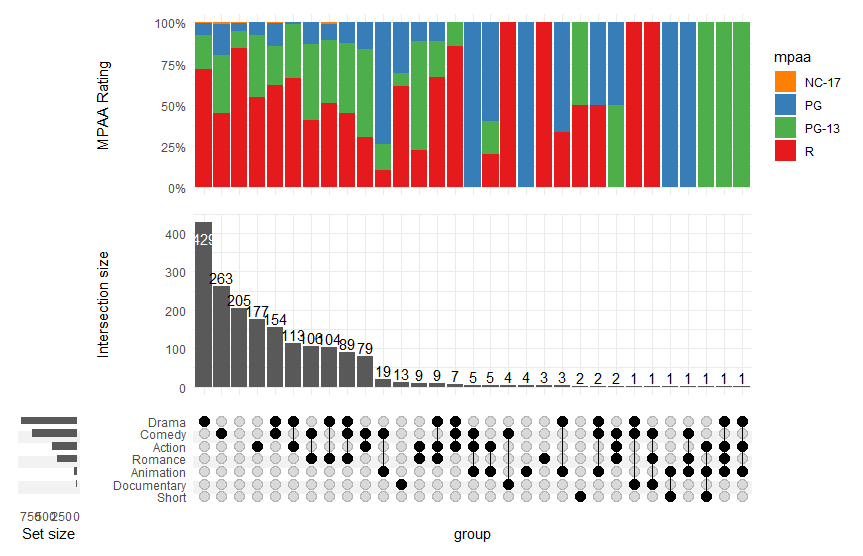
upset(
  movies,
  genres,
  annotations = list(
    'MPAA Rating'=(
      ggplot(mapping=aes(fill=mpaa))
      + geom_bar(stat='count', position='fill')
      + scale_y_continuous(labels=scales::percent_format())
      + scale_fill_manual(values=c(
        'R'='#E41A1C', 'PG'='#377EB8',
        'PG-13'='#4DAF4A', 'NC-17'='#FF7F00'
      ))
      + ylab('MPAA Rating')
    )
  ),
  width_ratio=0.1
)

4. さいごに
これは、かなり強力なツールですね。
