【R】ggcats
2021年5月9日
1. はじめに
ggcatsは、猫でggplotにグラフを描けるgeomです。
2. インストール
Githubからインストールできます。
remotes::install_github("R-CoderDotCom/ggcats@main")3. つかってみる
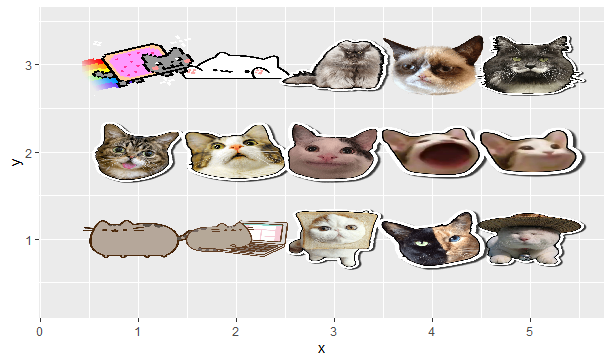
使用できる猫はこちらのとおり。
library(ggcats)
library(ggplot2)

grid <- expand.grid(1:5, 3:1)

df <- data.frame(x = grid[, 1],
                 y = grid[, 2],
                 image = c("nyancat", "bongo",
                           "colonel", "grumpy",
                           "hipster", "lil_bub",
                           "maru", "mouth",
                           "pop", "pop_close",
                           "pusheen", "pusheen_pc",
                           "toast", "venus",
                           "shironeko"))

ggplot(df) +
  geom_cat(aes(x, y, cat = image), size = 5) +
  xlim(c(0.25, 5.5)) +
  ylim(c(0.25, 3.5))

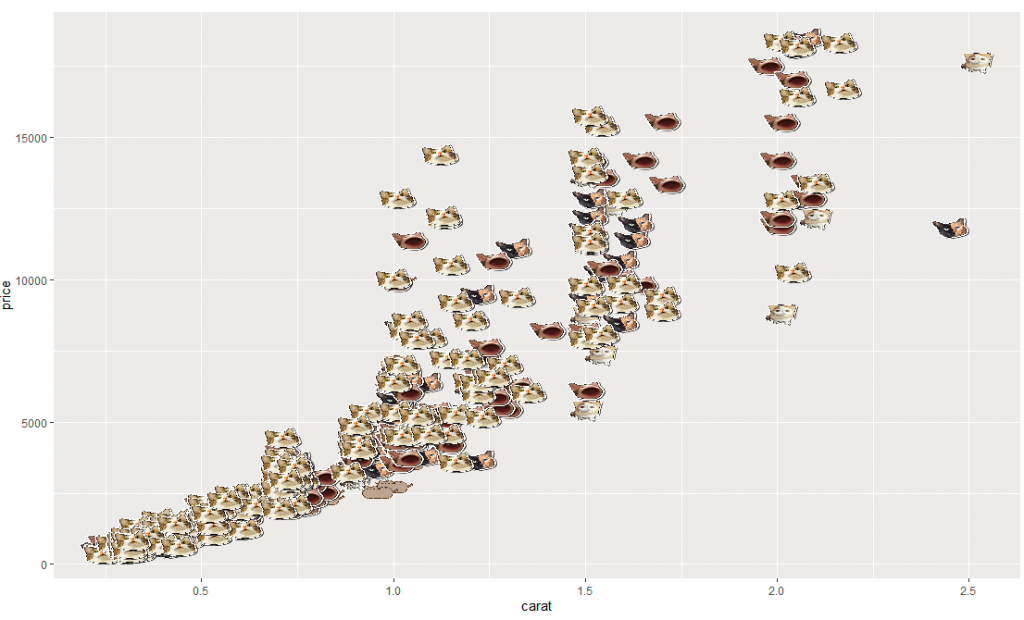
では、実際にグラフを描いてみます。diamondsのデータから500だけサンプリングしてcutのレベルを5つの猫に割り当ててcaratに対するpriceのグラフにします。geom_catで猫画像が表示されます。
diamonds %>%
  sample_n(500) %>%
  mutate(cat=factor(cut, labels = c("pusheen", "toast", "venus", "pop", "maru"))) %>%
  ggplot(aes(carat, price)) +
  geom_cat(aes(cat = cat), size = 1)

4. さいごに
実は、猫はそれほど好きではないのですが、こういうグラフをみるとほっこりします。

