【R】ggqr
2021年8月6日
1. はじめに
ggqrは、QRコードのgeomをggplotに追加してくれるパッケージです。
2. インストール
Githubからインストールできます。
remotes::install_github('coolbutuseless/ggqr')3. つかってみる
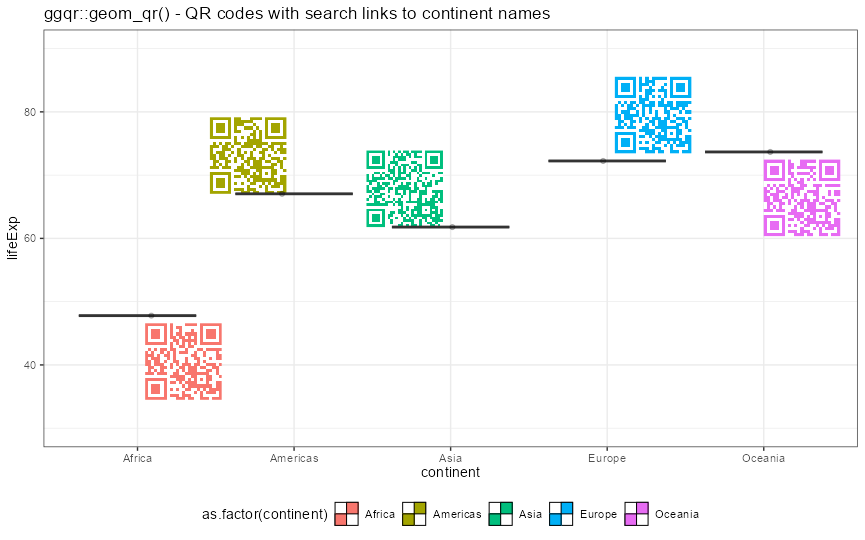
こんな感じで, geom_qr()を使います。
library(ggplot2)
library(ggqr)
library(gapminder)
library(tidyverse)

dat <- aggregate(lifeExp ~ continent, gapminder, median)
dat$name   <- paste0("https://duckduckgo.com/?q=", dat$lifeExp)
dat$hjust <- c(-0.1, 1.1, 1.1, -0.1,   0)
dat$vjust <- c( 1.1, 0.0, 0.0, -0.1, 1.1)

ggplot(dat, aes(x = continent, y = lifeExp)) +
  geom_qr(aes(x = continent,
              y = lifeExp,
              label = name,
              hjust = I(hjust),
              vjust = I(vjust),
              col   = as.factor(continent)
  ),
  size = 0.8
  ) +
  coord_cartesian(ylim=c(30,90)) +
  geom_boxplot(outlier.colour = "hotpink") +
  geom_jitter(position = position_jitter(width = 0.1, height = 0), alpha = 1/4) +
  theme_bw() +
  theme(legend.position = 'bottom') +
  labs(title = "ggqr::geom_qr() - QR codes with search links to continent names")
4. さいごに
手軽に情報を調べるのにはQRコードは便利ですね。グラフとか表で出てきた単語とかもサッと調べられそうで良いパッケージです。
