【R】gtfs2gps
2021年8月14日
1. はじめに
gtfs2gpsは、公共交通機関で使用されるGTFSデータをGPS形式に変更してくれるパッケージです。
2. インストール
CRANからインストールできます。
install.packages("gtfs2gps")3. つかってみる
まず、データを読み込みます。デフォルトで入っているデータを使ってみます。
library("data.table")
library("gtfs2gps")
sao <- read_gtfs(system.file("extdata/saopaulo.zip", package ="gtfs2gps"))
names(sao)
> names(sao)
[1] "agency"      "calendar"    "frequencies" "routes"      "shapes"      "stop_times"  "stops"
[8] "trips"
こんな感じで公共交通機関のデータが含まれています。
sao$calendar
sao$shapes
> sao$calendar
   service_id monday tuesday wednesday thursday friday saturday sunday start_date end_date
1:        USD      1       1         1        1      1        1      1   20080101 20200101
2:        U__      1       1         1        1      1        0      0   20080101 20200101
3:        US_      1       1         1        1      1        1      0   20080101 20200101
4:        _SD      0       0         0        0      0        1      1   20080101 20200101
5:        __D      0       0         0        0      0        0      1   20080101 20200101
6:        _S_      0       0         0        0      0        1      0   20080101 20200101
> sao$shapes
       shape_id shape_pt_lat shape_pt_lon shape_pt_sequence
    1:    52421    -23.52212    -46.56379                 1
    2:    52421    -23.52157    -46.56276                 2
    3:    52421    -23.52129    -46.56222                 3
    4:    52421    -23.52124    -46.56212                 4
    5:    52421    -23.52108    -46.56183                 5
   ---
35882:    52135    -23.58944    -46.63342               267
35883:    52135    -23.58945    -46.63349               268
35884:    52135    -23.58945    -46.63354               269
35885:    52135    -23.58946    -46.63366               270
35886:    52135    -23.58946    -46.63370               271
データを扱うためのフィルターがいくつかあります。
- filter_by_shape_id()
- filter_by_agency_id()
- filter_valid_stop_times()
- filter_week_days()
- filter_single_trip():
- filter_by_route_type()
- filter_by_route_id()
- filter_day_period()
- remove_invalid()
sao_route <- filter_by_route_id(sao, 1726-10)
> sao_route
$agency
agency_id agency_name agency_url agency_timezone agency_lang
1: 1 SPTRANS http://www.sptrans.com.br/?versao=180619 America/Sao_Paulo pt
$calendar
service_id monday tuesday wednesday thursday friday saturday sunday start_date end_date
1: USD 1 1 1 1 1 1 1 20080101 20200101
2: U__ 1 1 1 1 1 0 0 20080101 20200101
3: US_ 1 1 1 1 1 1 0 20080101 20200101
4: _SD 0 0 0 0 0 1 1 20080101 20200101
5: __D 0 0 0 0 0 0 1 20080101 20200101
6: _S_ 0 0 0 0 0 1 0 20080101 20200101
$frequencies
Empty data.table (0 rows and 4 cols): trip_id,start_time,end_time,headway_secs
$routes
Empty data.table (0 rows and 3 cols): agency_id,route_id,route_type
$shapes
Empty data.table (0 rows and 4 cols): shape_id,shape_pt_lat,shape_pt_lon,shape_pt_sequence
$stop_times
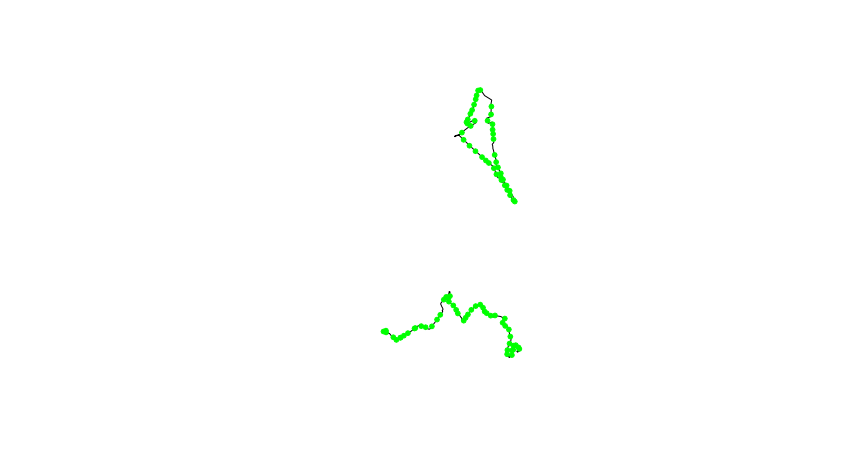
Empty data.table (0 rows and 5 cols): trip_id,arrival_time,departure_time,stop_id,stop_sequence次のようにルートと停留所を描画もできます。
sao_shape <- filter_by_shape_id(sao, c(51338, 52135))

sao_shapes_sf <- gtfs_shapes_as_sf(sao_shape)
sao_stops_sf <- gtfs_stops_as_sf(sao_shape)
plot(sf::st_geometry(sao_shapes_sf))
plot(sf::st_geometry(sao_stops_sf), pch = 20, col = "green", add = TRUE)
GTFSからGPSに変換するには、gtfs2gps関数を利用します。
sao_gps <- gtfs2gps(sao)
head(sao_gps)
> head(sao_gps)
id shape_id trip_id trip_number route_type shape_pt_lon shape_pt_lat departure_time stop_id
1: 1 50784 407E-10-0 1 3 -46.44303 -23.63370 00:00:00 770007651
2: 2 50784 407E-10-0 1 3 -46.44290 -23.63336 00:00:26 <NA>
3: 3 50784 407E-10-0 1 3 -46.44285 -23.63315 00:00:42 <NA>
4: 4 50784 407E-10-0 1 3 -46.44270 -23.63269 00:00:52 770007650
5: 5 50784 407E-10-0 1 3 -46.44269 -23.63263 00:00:53 <NA>
6: 6 50784 407E-10-0 1 3 -46.44275 -23.63234 00:01:00 <NA>
stop_sequence dist cumdist cumtime speed
1: 1 0.000000 [m] 0.00000 [m] 0.00000 [s] 5.558455 [km/h]
2: NA 39.873149 [m] 39.87315 [m] 25.82432 [s] 5.558455 [km/h]
3: NA 24.678450 [m] 64.55160 [m] 41.80762 [s] 5.558455 [km/h]
4: 2 52.793554 [m] 117.34515 [m] 52.01429 [s] 18.620850 [km/h]
5: NA 6.587615 [m] 123.93277 [m] 53.28788 [s] 18.620850 [km/h]
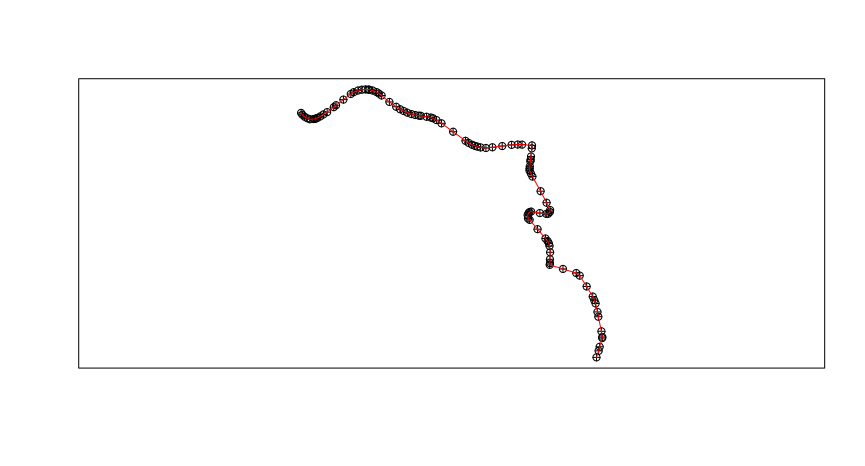
6: NA 33.248587 [m] 157.18135 [m] 59.71588 [s] 18.620850 [km/h]最初の100点をプロットしてみます。
sao_gps100 <- sao_gps[1:100, ]

sao_gps100_sfpoints <- gps_as_sfpoints(sao_gps100)
sao_gps100_sflinestring <- gps_as_sflinestring(sao_gps100)

plot(sf::st_geometry(sao_gps100_sfpoints), pch = 10)
plot(sf::st_geometry(sao_gps100_sflinestring), col = "red", add = TRUE)
box()
4. さいごに
公共交通機関のデータをGPS形式でも扱えると嬉しいですね。
