【R】gantrify
2021年9月11日
1. はじめに
gantrifyは、ggplotと連携したガントチャートを描画するパッケージです。
2. インストール
Githubからインストールします。
remotes::install_github("giocomai/ganttrify")3. つかってみる
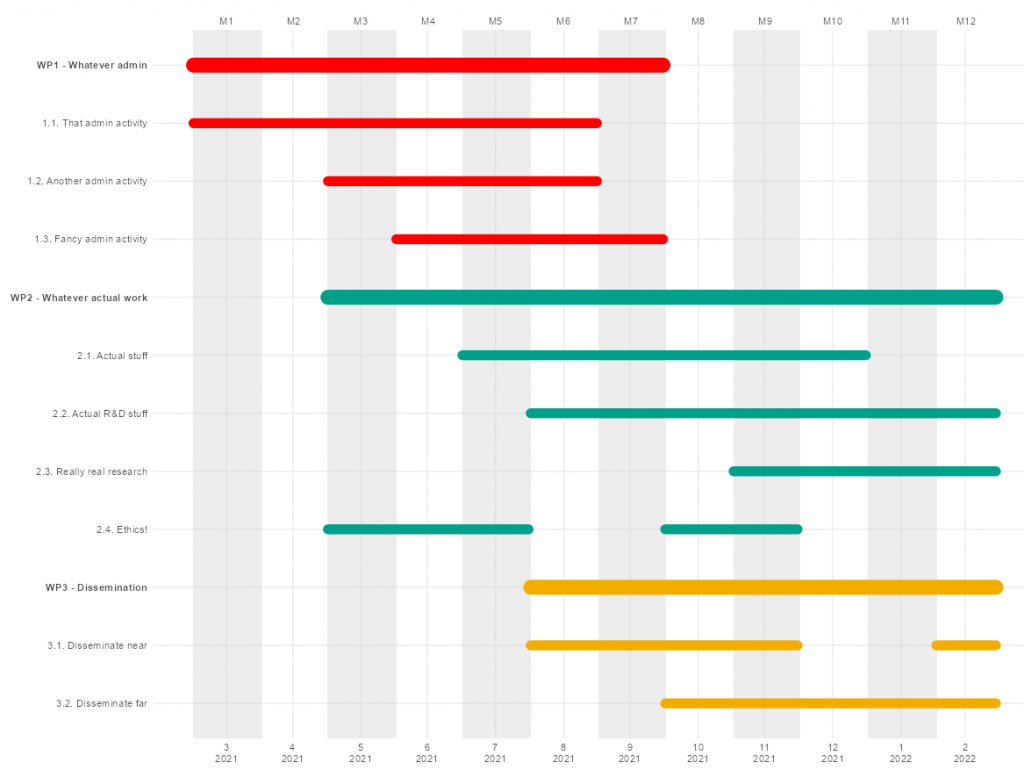
パッケージに付属のデータを使ってみます。
library("ganttrify")

ganttrify::test_project
> ganttrify::test_project
# A tibble: 11 x 4
   wp                         activity                    start_date end_date
   <chr>                      <chr>                            <dbl>    <dbl>
 1 WP1 - Whatever admin       1.1. That admin activity             1        6
 2 WP1 - Whatever admin       1.2. Another admin activity          3        6
 3 WP1 - Whatever admin       1.3. Fancy admin activity            4        7
 4 WP2 - Whatever actual work 2.1. Actual stuff                    5       10
 5 WP2 - Whatever actual work 2.2. Actual R&D stuff                6       12
 6 WP2 - Whatever actual work 2.3. Really real research            9       12
 7 WP2 - Whatever actual work 2.4. Ethics!                         3        5
 8 WP2 - Whatever actual work 2.4. Ethics!                         8        9
 9 WP3 - Dissemination        3.1. Disseminate near                6        9
10 WP3 - Dissemination        3.1. Disseminate near               12       12
11 WP3 - Dissemination        3.2. Disseminate far                 8       12
ganttrify(project = ganttrify::test_project,
project_start_date = "2021-03",
font_family = "Roboto Condensed")
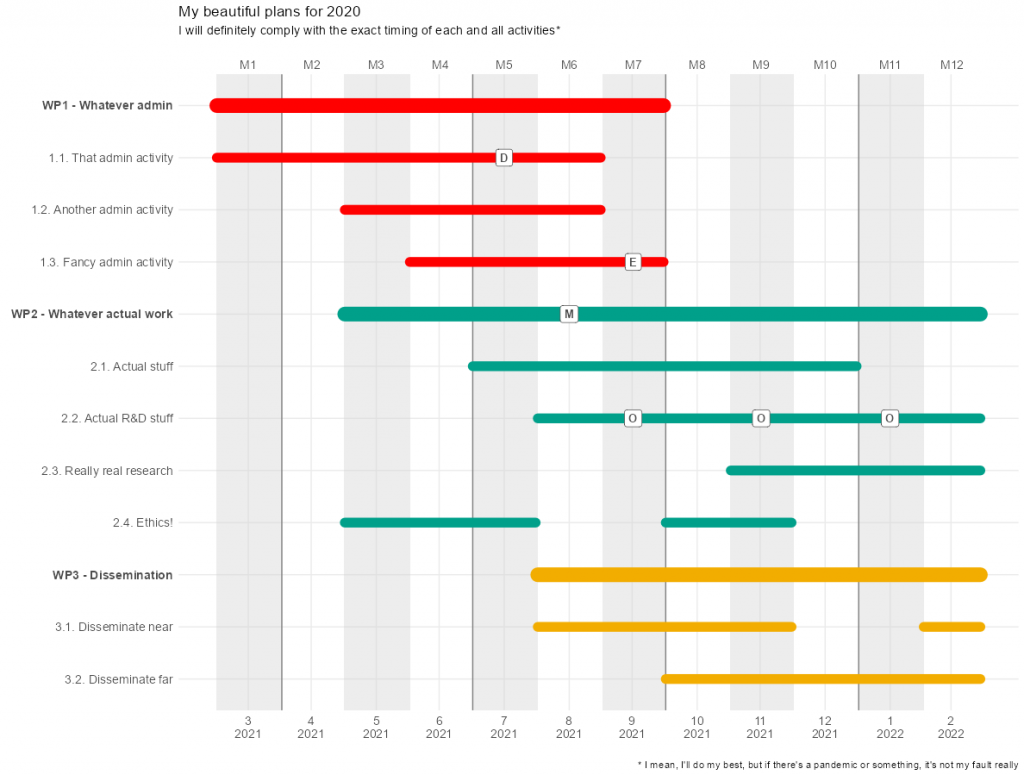
スポットデータを付加できます。
ganttrify::test_spots
> ganttrify::test_spots
# A tibble: 6 x 3
  activity                   spot_type spot_date
  <chr>                      <chr>         <dbl>
1 1.1. That admin activity   D                 5
2 1.3. Fancy admin activity  E                 7
3 2.2. Actual R&D stuff      O                 7
4 2.2. Actual R&D stuff      O                 9
5 2.2. Actual R&D stuff      O                11
6 WP2 - Whatever actual work M                 6
ggplotですのでタイトル等も簡単に付けられます。
ganttrify(project = ganttrify::test_project,
          spots = ganttrify::test_spots,
          project_start_date = "2021-03",
          size_text_relative = 1.2,
          mark_quarters = TRUE,
          font_family = "Roboto Condensed")+
  ggplot2::labs(title = "My beautiful plans for 2020",
                subtitle = "I will definitely comply with the exact timing of each and all activities*",
                caption = "* I mean, I'll do my best, but if there's a pandemic or something, it's not my fault really")
4. さいごに
きれいなガントチャートが描けるうれしいパッケージです。
