【R】都道府県別 砂糖消費量
2020年1月10日
2018年の都道府県別の一人当たりの砂糖消費量を描画してみます。
library(leaflet)

dat <- read.csv("http://www.dinov.tokyo/Data/JP_Pref/Pref_data.csv", header = TRUE,
                fileEncoding="UTF-8")

datc_m <- cut(dat$さとう, hist(dat$さとう, plot=FALSE)$breaks, right=FALSE)
datc_mcol <- rainbow(length(levels(datc_m)))[as.integer(datc_m)]
windowsFonts(JP1=windowsFont("MS Gothic"),
             JP2=windowsFont("MS Mincho"),
             JP3=windowsFont("Meiryo"),
             JP4=windowsFont("Biz Gothic"))
windows(width=800, height=800)
par(family="JP4")

library(NipponMap)
JapanPrefMap(datc_mcol, main="2018年度都道府県別 一人当たりの砂糖消費量 g ")
legend("bottomright", fill=rainbow(length(levels(datc_m))), legend=names(table(datc_m)))
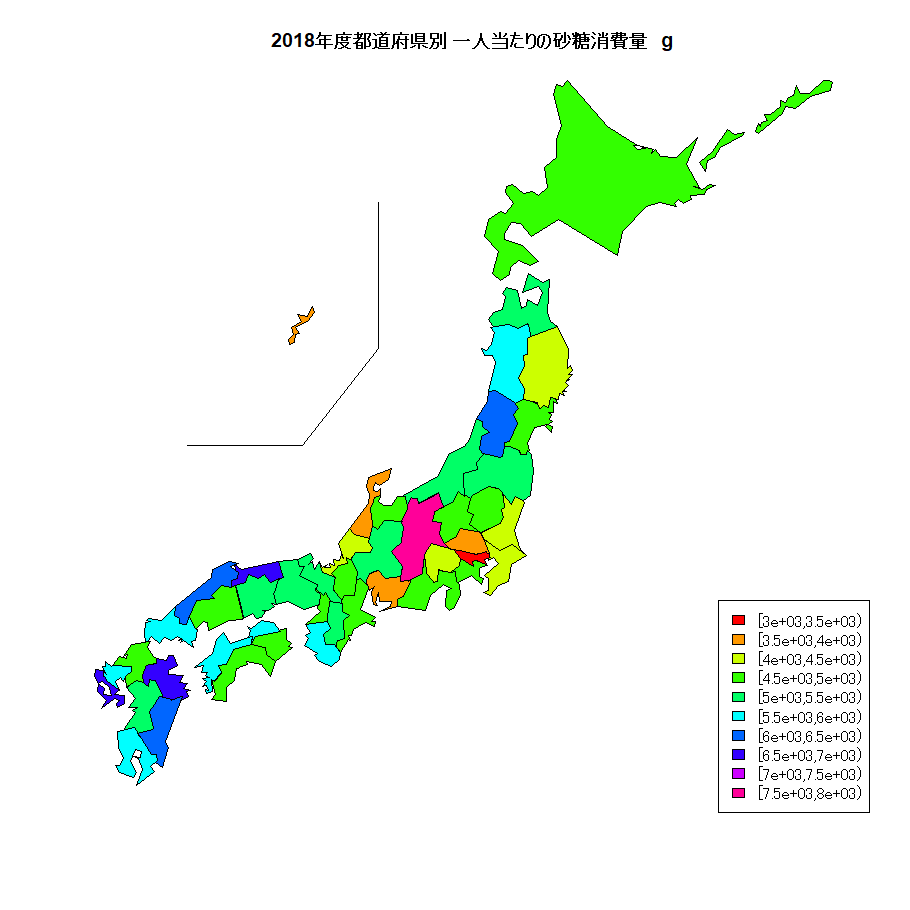
こんな感じですが、意外や意外、長野がトップ!首都圏の方が消費量が多いと思っていたのですが、逆に少なめ。健康志向?それに、石川県や愛知県は和菓子を多く食べると思っていたのですが。。。意外と砂糖の消費量は少ないですね。
