【R】世界のダイヤモンド産出国順位
2020年10月31日
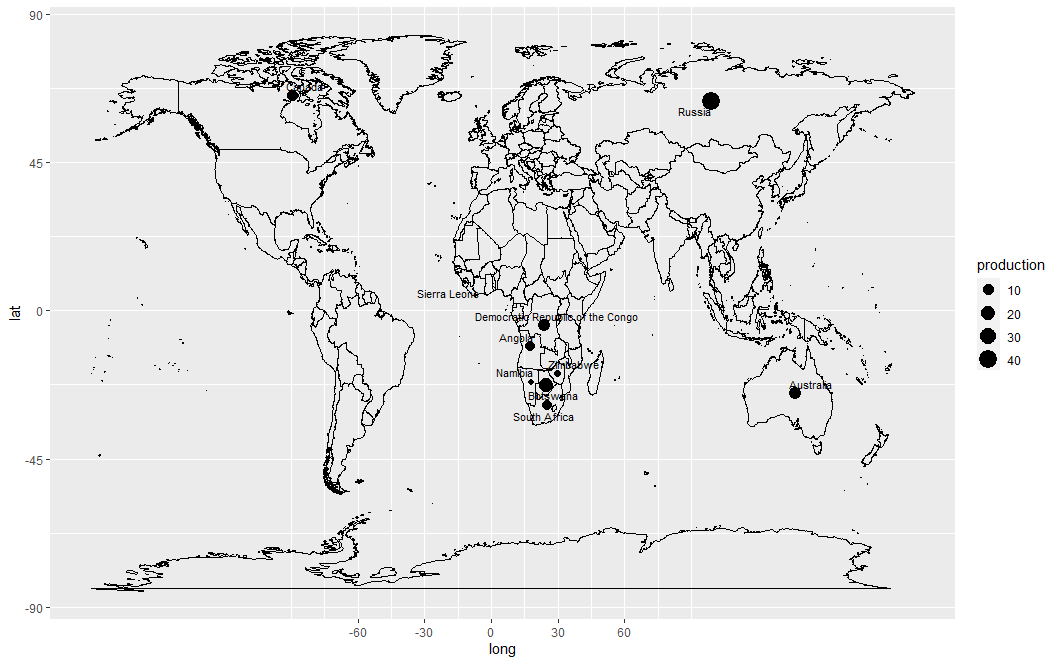
ダイヤモンドの産出国を順位付けして世界地図に表示してみます。元のデータは、Wikipediaの「List of countries by diamond production」からとってきました。2016年のデータでちょっと古いですが。
rvestパッケージを利用してスクレイピングしました。いくつかのページを見たのですが、Wikipediaのページが一番データを取得しやすかったです。といっても、能力不足からか、ここまで来るのに、結構時間がかかりました。。。
library(tidyverse)
library(rvest)
library(ggplot2)
library(ggrepel)
library(stringr)
library(ggplot2)
library(maps)
library(kableExtra)
library(clipr)

webpage <- read_html("https://en.wikipedia.org/wiki/List_of_countries_by_diamond_production")

tbls <- html_nodes(webpage, "table")

head(tbls)

dat <- webpage %>%
  html_nodes(xpath="//table") %>%
  html_text()

dat2 <- str_split(dat, pattern = "\n")
country <- c(dat2[[1]][8], #もっとスマートにやりたかったのですが。。。。
             dat2[[1]][11],
             dat2[[1]][14],
             dat2[[1]][17],
             dat2[[1]][20],
             dat2[[1]][23],
             dat2[[1]][26],
             dat2[[1]][29],
             dat2[[1]][32],
             dat2[[1]][35])%>%
  str_replace(pattern=" ", replacement="") %>%
  str_replace(pattern="DR Congo", replacement = "Democratic Republic of the Congo")

production <- c(dat2[[1]][9],
                dat2[[1]][12],
                dat2[[1]][15],
                dat2[[1]][18],
                dat2[[1]][21],
                dat2[[1]][24],
                dat2[[1]][27],
                dat2[[1]][30],
                dat2[[1]][33],
                dat2[[1]][36]) %>%
  as.numeric()

table<-data.frame("region"=country, "production"=production) #産出国のトップ10をやっと整理できた。

world <- map_data("world")

dat_coord <- world %>%
  group_by(region) %>%
  summarise('center_long' = mean(long), 'center_lat' = mean(lat))  %>%
  left_join(table, by='region') %>%
  drop_na('production') %>%
  arrange(desc(production))

#ここからやっと地図を描きます。
diamond_production <- ggplot(world, aes(x=long, y=lat, group = group)) +
  geom_path() +
  scale_x_continuous(breaks = (-2:2) * 30) +
  scale_y_continuous(breaks = (-4:4) * 45) +
  geom_point(data = dat_coord,
             aes(x=center_long, y=center_lat, group = production, size = production)) +
  geom_text_repel(data = dat_coord, aes(x = center_long, y = center_lat, label = region, group = region), col="black", size = 3)

diamond_production

#表を書きます。
table %>%
  kable(align = "c", row.names=FALSE) %>%
  kable_styling(full_width = F) %>%
  column_spec(1, bold = T) %>%
  collapse_rows(columns = 1, valign = "middle") %>%
  write_clip
| region | production |
|---|---|
| Russia | 40.0 |
| Botswana | 20.9 |
| Australia | 13.9 |
| Democratic Republic of the Congo | 12.3 |
| Canada | 11.1 |
| Angola | 9.0 |
| South Africa | 8.4 |
| Zimbabwe | 2.1 |
| Namibia | 1.5 |
| Sierra Leone | 0.5 |