【R】都道府県別 平均余命を地図に表示
2019年12月17日
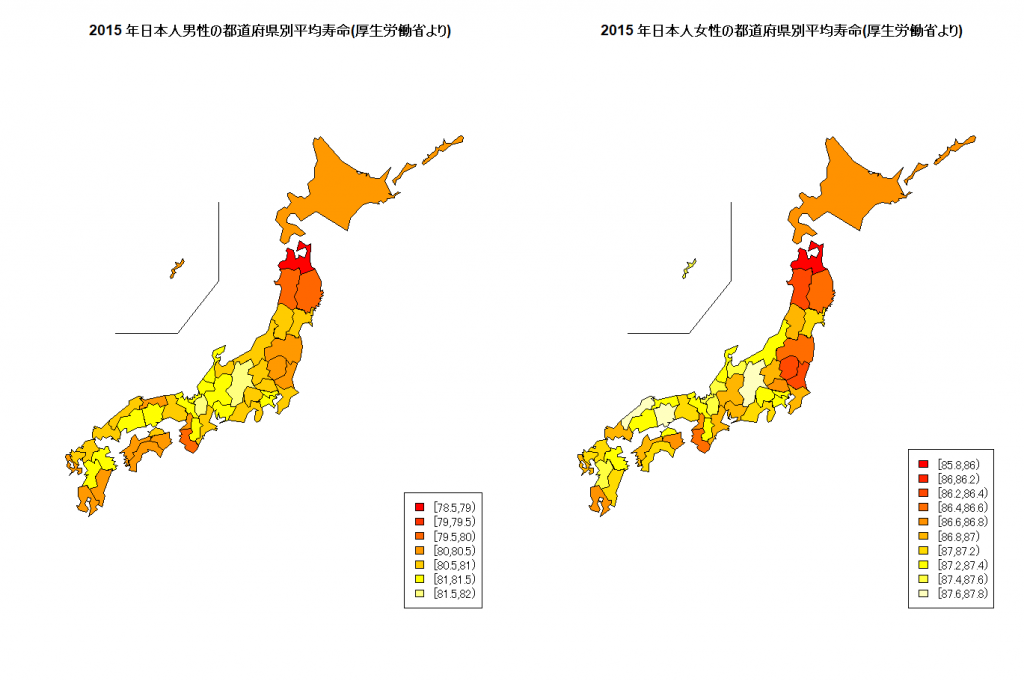
厚生労働省が公表した「平成27年都道府県別生命表の概況」から、都道府県別の平均寿命を地図上に表示してみる。
library(leaflet)


dat <- read.csv("http://www.dinov.tokyo/Data/JP_Pref/Pref_LifeExpectancy.csv", header = TRUE,
                 fileEncoding="CP932")
datc_m <- cut(dat$男性, hist(dat$男性, plot=FALSE)$breaks, right=FALSE)
datc_f <- cut(dat$女性, hist(dat$女性, plot=FALSE)$breaks, right=FALSE)
datc_mcol <- heat.colors(length(levels(datc_m)))[as.integer(datc_m)]
datc_fcol <- heat.colors(length(levels(datc_f)))[as.integer(datc_f)]
windowsFonts(JP1=windowsFont("MS Gothic"),
             JP2=windowsFont("MS Mincho"),
             JP3=windowsFont("Meiryo"),
             JP4=windowsFont("Biz Gothic"))
windows(width=1200, height=800)
par(family="JP4")
layout(matrix(1:2, 1, 2))
library(NipponMap)
JapanPrefMap(datc_mcol, main="2015 年日本人男性の都道府県別平均寿命(厚生労働省より)")
legend("bottomright", fill=heat.colors(length(levels(datc_m))), legend=names(table(datc_m)))
JapanPrefMap(datc_fcol, main="2015 年日本人女性の都道府県別平均寿命(厚生労働省より)")
legend("bottomright", fill=heat.colors(length(levels(datc_f))), legend=names(table(datc_f)))
結果はこうなりました。やはり地域差がありそうです。気候や食生活が影響しているのかもしれません。