【R】ggpol
2021年6月23日
1. はじめに
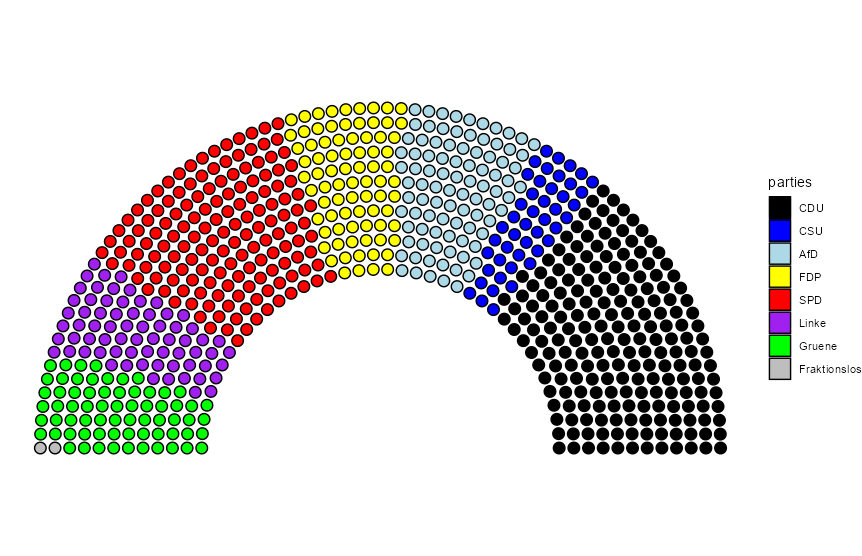
ggpolは、ggplot2の拡張機能であるparliament diagrams等やその他の可視化ツールを提供します。
2. インストール
CRANからインストールできます。
install.packages("ggpol")3. つかってみる
例をそのまま見てみます。
bt <- data.frame(
 parties = factor(c("CDU", "CSU", "AfD", "FDP", "SPD",
                    "Linke", "Gruene", "Fraktionslos"),
                  levels = c("CDU", "CSU", "AfD", "FDP", "SPD",
                             "Linke", "Gruene", "Fraktionslos")),
 seats   = c(200, 46, 92, 80, 153, 69, 67, 2),
 colors  = c("black", "blue", "lightblue", "yellow",
             "red","purple", "green", "grey"),
 stringsAsFactors = FALSE)

ggplot(bt) +
  geom_parliament(aes(seats = seats, fill = parties), color = "black") +
  scale_fill_manual(values = bt$colors, labels = bt$parties) +
  coord_fixed() +
  theme_void()

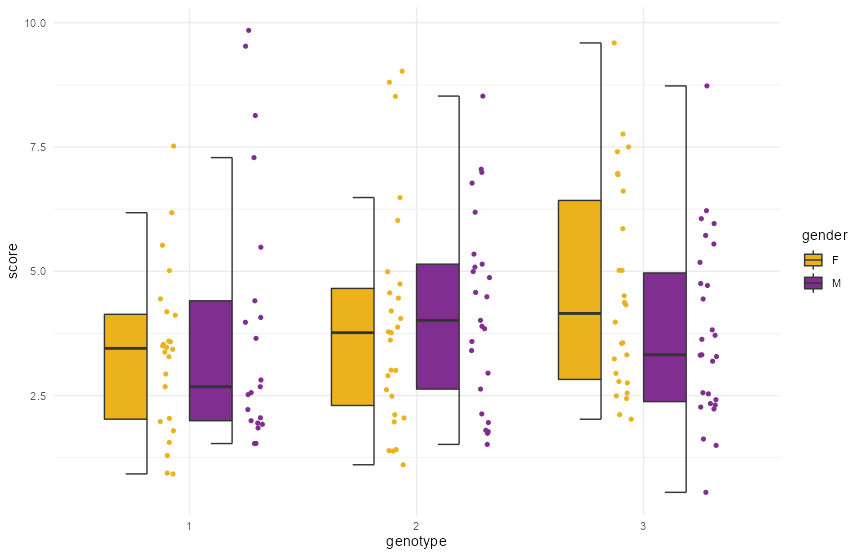
df <- data.frame(score = rgamma(150, 4, 1),
                 gender = sample(c("M", "F"), 150, replace = TRUE),
                 genotype = factor(sample(1:3, 150, replace = TRUE)))

ggplot(df) + geom_boxjitter(aes(x = genotype, y = score, fill = gender),
                            jitter.shape = 21, jitter.color = NA,
                            jitter.params = list(height = 0, width = 0.04),
                            outlier.color = NA, errorbar.draw = TRUE) +
  scale_fill_manual(values = c("#ecb21e", "#812e91")) +
  theme_minimal()

4. さいごに
なんだかいろいろできそうですが、今日はここまで。
